Dashboard Check
In this chapter, we will provide a quick way to verify the correct operational status of a Request Router configuration with the anynode target systems.
Switch to to perform this check.
In the dashboard, check the Primary Edge State and Secondary Edge State under Request Router. Both should be set to Operational.
Hovering over the Transport Connections display shows the number of anynode systems currently experiencing Low Load, Medium Load, or High Load.
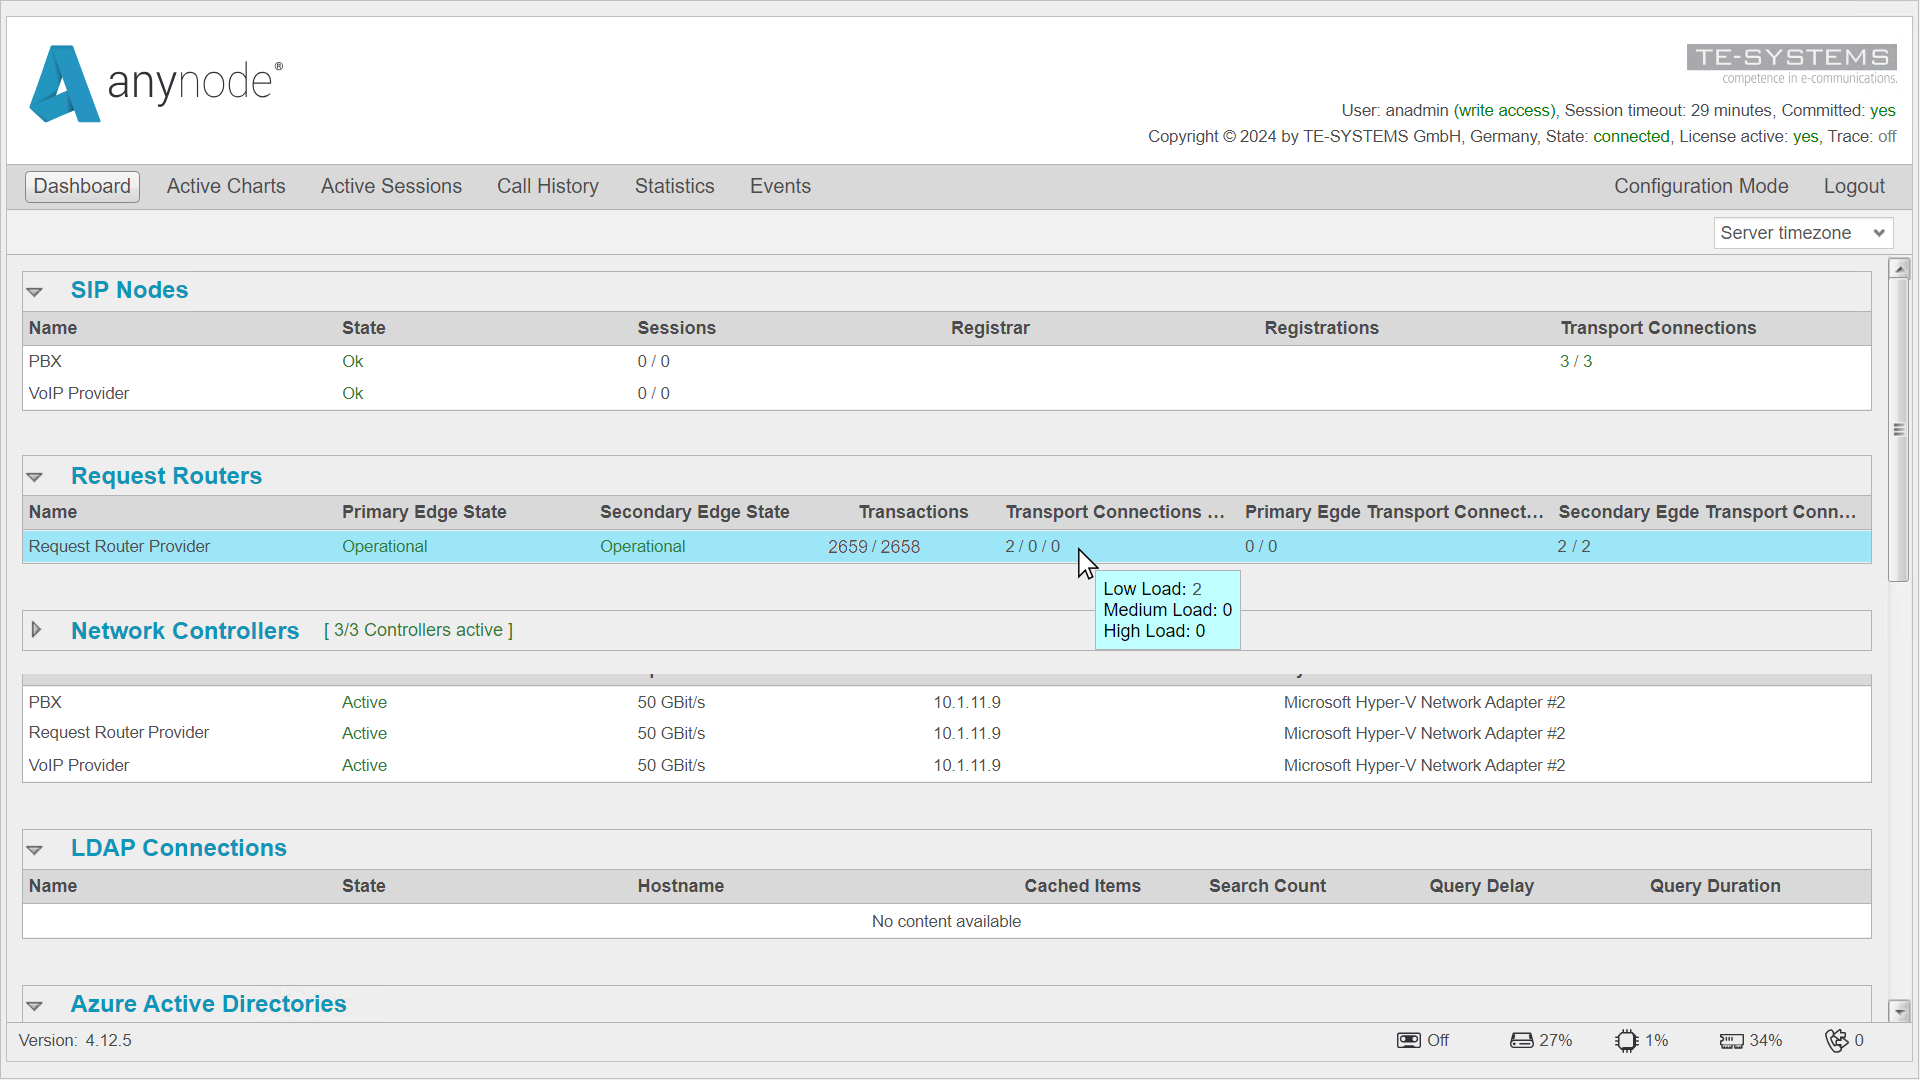
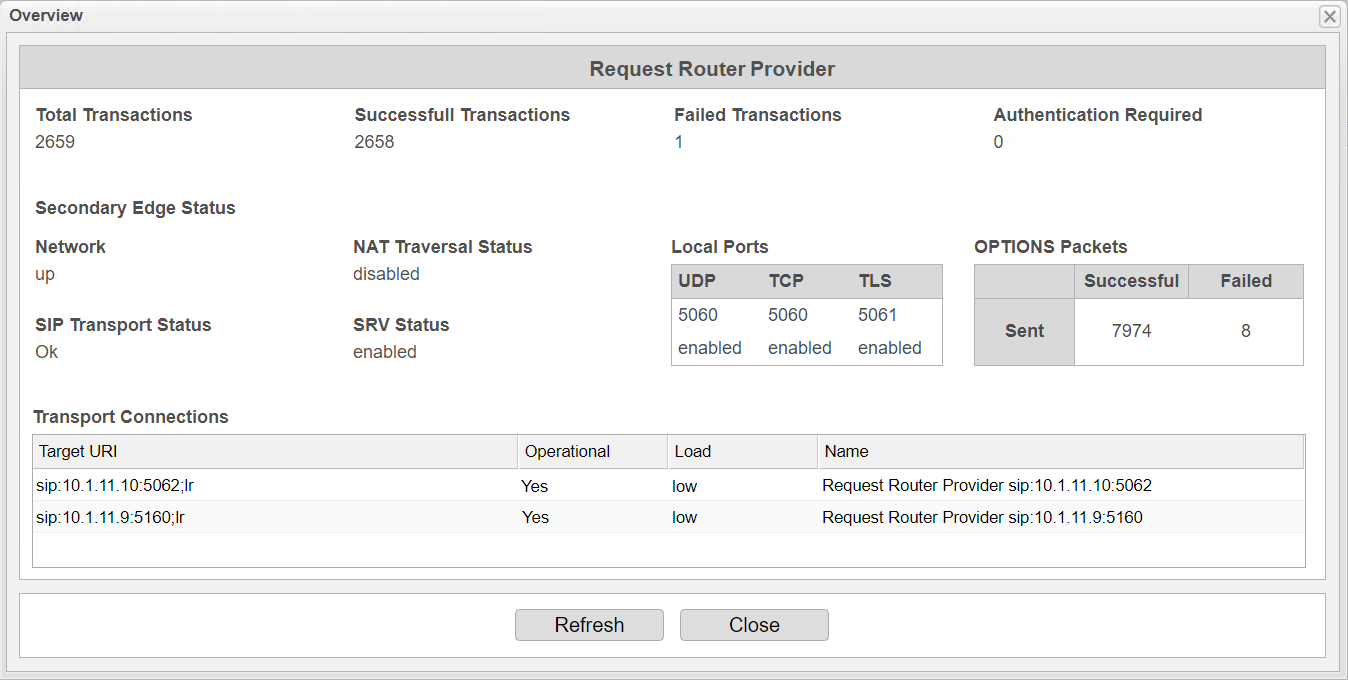
Click on the Request Router entry to view more details.
Monitor the OPTIONS packets display, which shows specific SIP messages exchanged to check the availability and status of the endpoint. In this case, the Request Router is successfully sending OPTIONS packets to the target nodes through the Secondary Edge.
Also, check the Operational Status of the Transport Connections, where the anynode target systems to which the calls are distributed are listed.
You have now successfully configured random call distribution to two anynode systems with the Request Router.