Test Calls
After completing the configuration process, it is highly recommended to make test calls and run traces to confirm that all nodes are functioning properly, and route entries are working as expected.
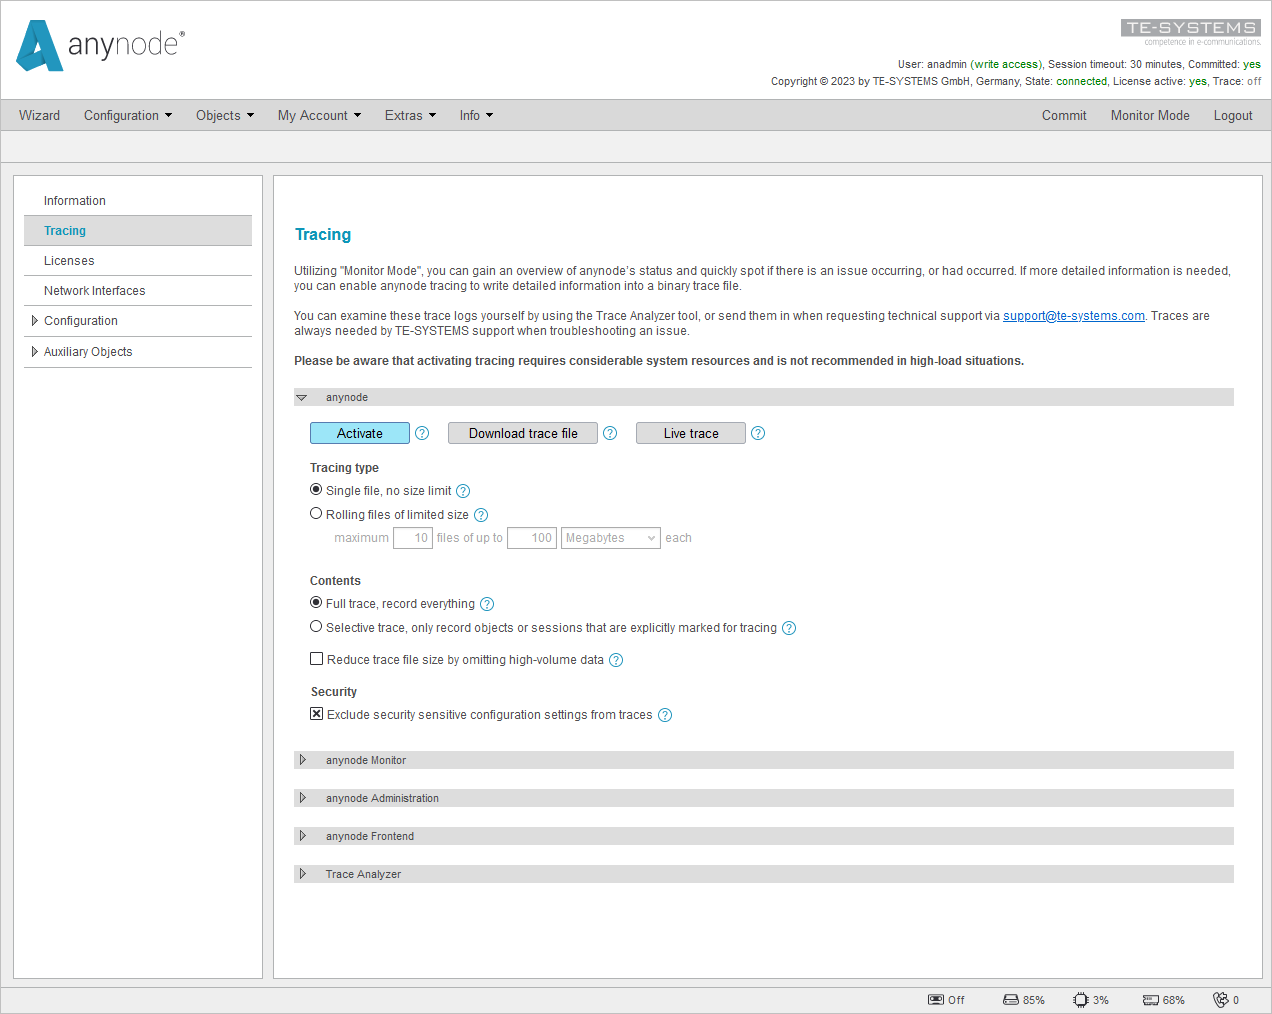
Now, switch to the Configuration Mode view and click Tracing in the left menu tree. There is also a shortcut via the trace display for instant access to the trace configuration. Click on Trace displayed in the top right corner of anynode's web frontend. There is also indicated whether a trace is currently active.
In case of VoIP-related problems, the communication between anynode and the remote endpoints is logged in a file once the trace function of anynode has been activated. This file can then be analyzed with the Trace Analyzer.
Start the trace recording just in time and before the actual call signaling, including any non-call related VoIP actions in anynode such as TLS handshakes, DNS lookups, SIP Register requests, database queries, and others are mandatory. The default trace conditions and settings are usually sufficient.
When you are ready for your test, you can start the trace. Click on to enable the trace recording.
Video: How you can analyze the SIP signaling flows via the anynode Trace Analyzer to troubleshoot issues when using anynode within your VoIP infrastructure.
Now, start a test call.
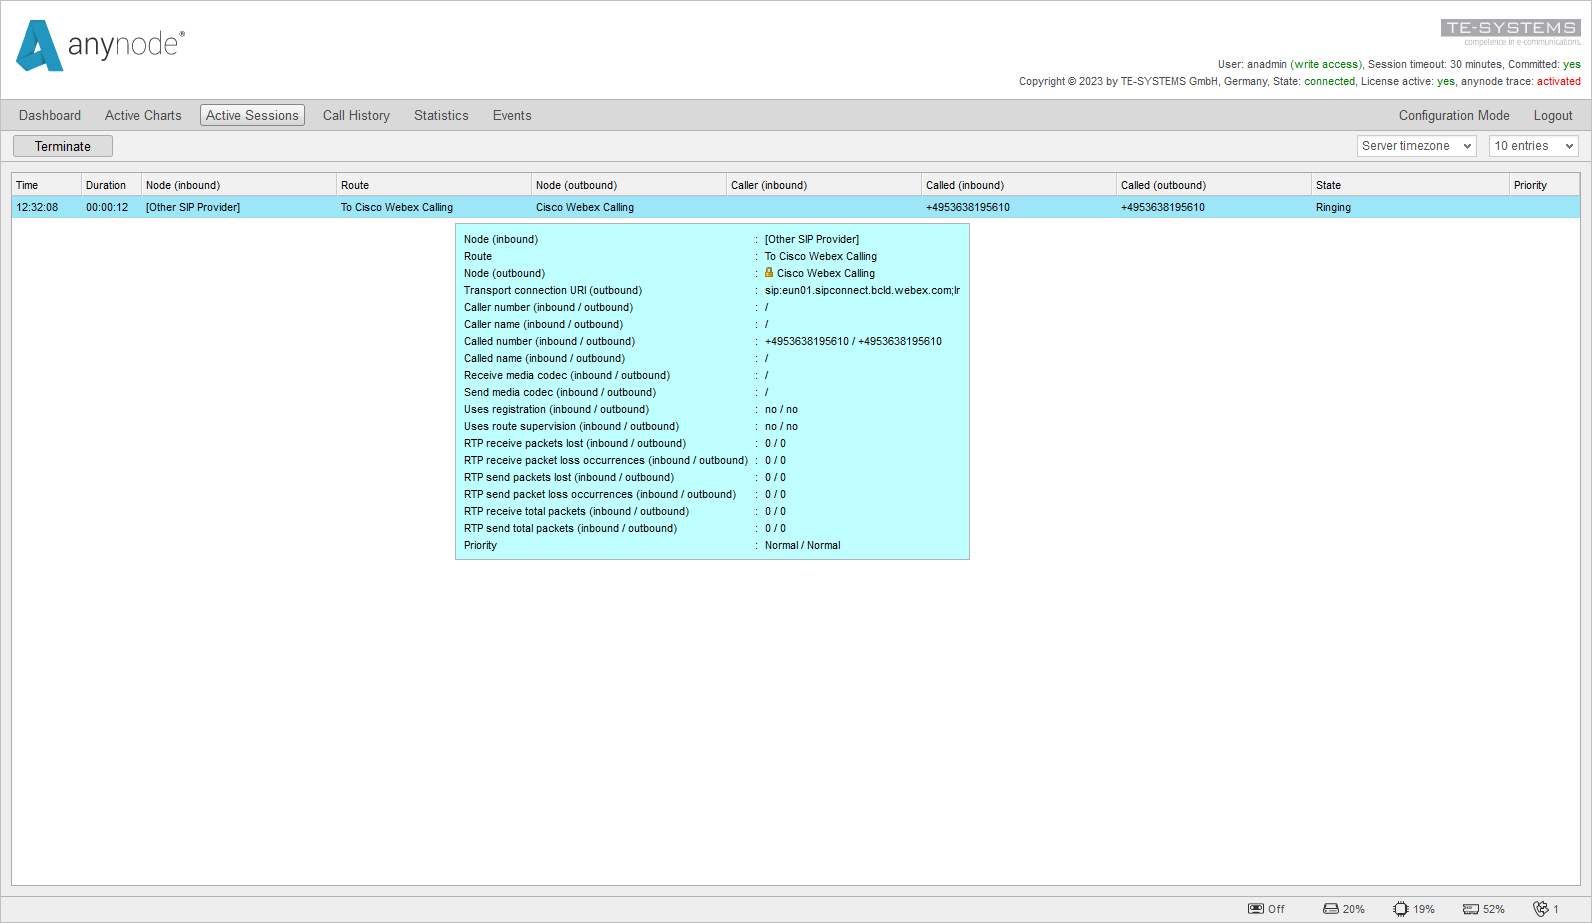
Switch to Monitor Mode in the upper right corner and click on Active Sessions to see all ongoing and completed calls.
To conduct an audio quality check, please engage in conversation on both ends of the call for a period of time.
Recently disconnected calls are also visible for 5 seconds, allowing immediate visibility of rejected or terminated calls.
In this example, we are doing a phone call through the SIP provider to a Cisco Webex client to verify the proper use of the defined route in anynode.
You can also view all past calls in the Call History section.
Now, switch to Configuration Mode again, and click on Tracing in the left menu tree.
Stop the trace recording with Deactivate. Then, you download the trace file from the server where anynode is installed by using the Download trace file function to save the trace to your desired location.
To analyze anynode trace files, TE-SYSTEMS provides the Trace Analyzer, a powerful Windows-based tool for analyzing and debugging anynode trace files. If you are working via remote access, the Trace Analyzer must be downloaded separately from the anynode server and installed on the workstation. You can also download the anynode Trace Analyzer directly to your Windows workstation from the anynode frontend with a click on Download Installer.
The anynode Trace Analyzer empowers you to identify the causes of problems very quickly, so you can choose whether to resolve it on your own or send in the anynode trace to our technical support (support@te-systems.com).
Open the trace with a double-click.
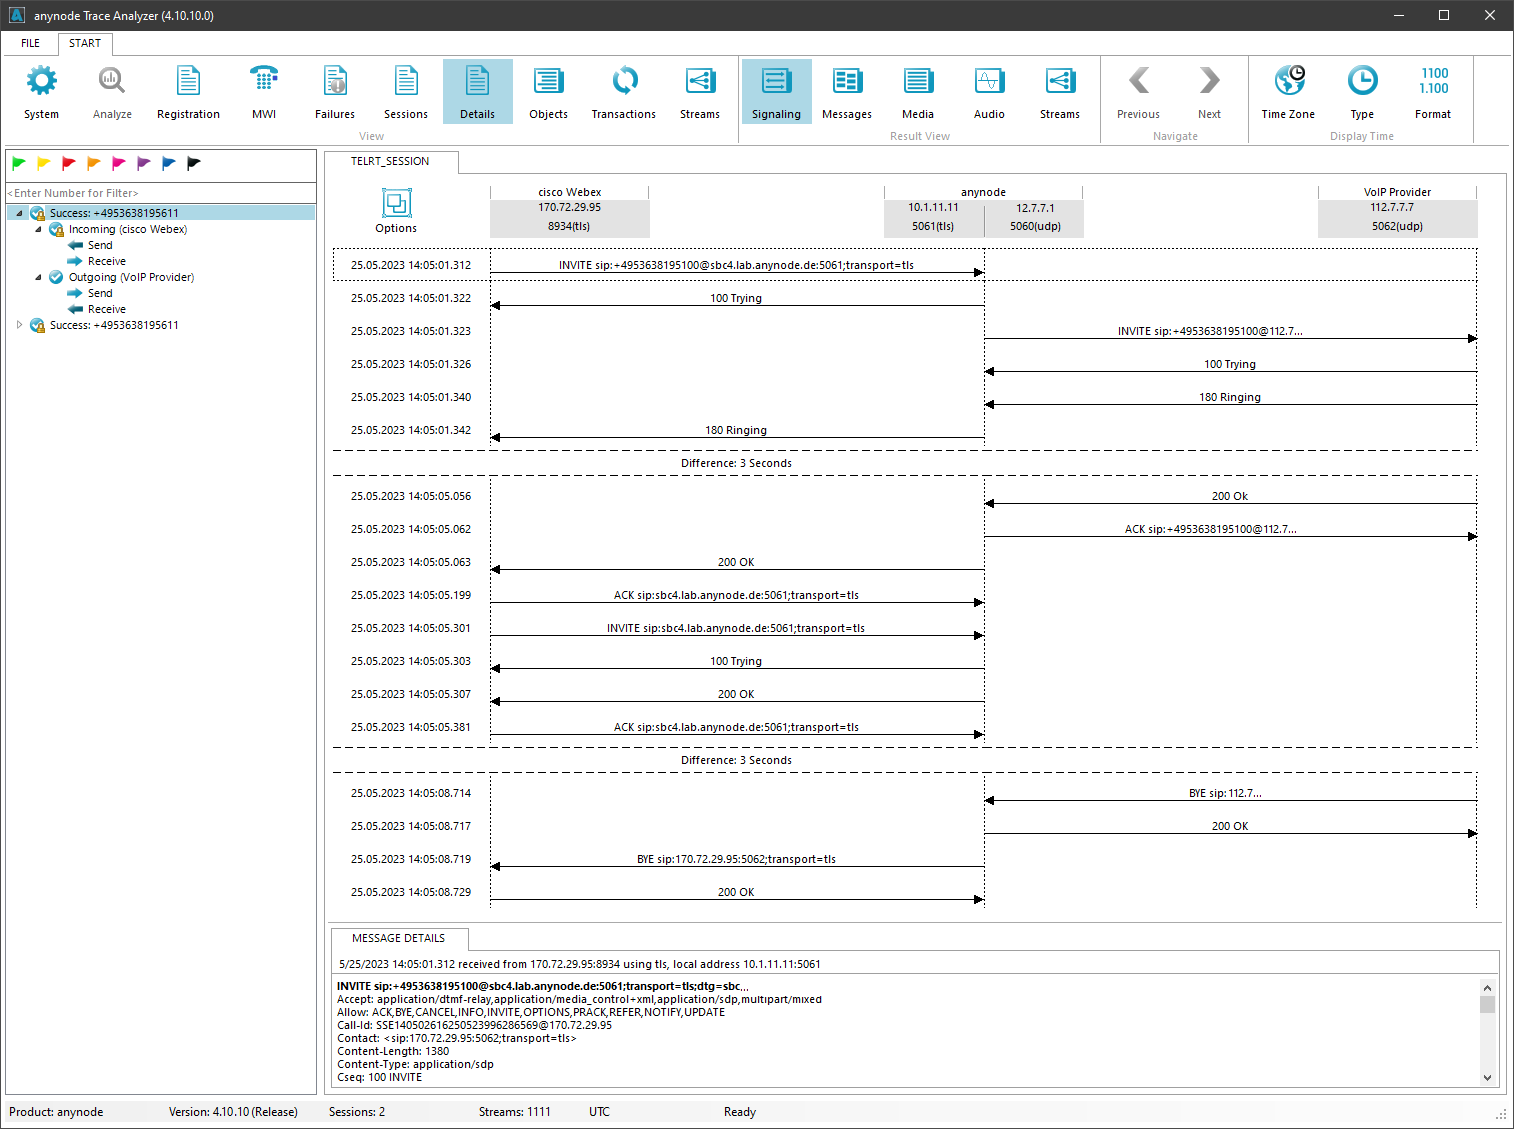
In the Trace Analyzer, select your session and double-click on it. This will provide a concise overview of the SIP message flow for each session, displaying information about combined or individual media-flow directions. The left side shows the origin of the call, with anynode displayed in the center. The centerline represents the call termination. On the right side, a completely new and independent call is established with distinct call IDs and SIP headers. Click on an Invite to view specific details about the SIP messages.
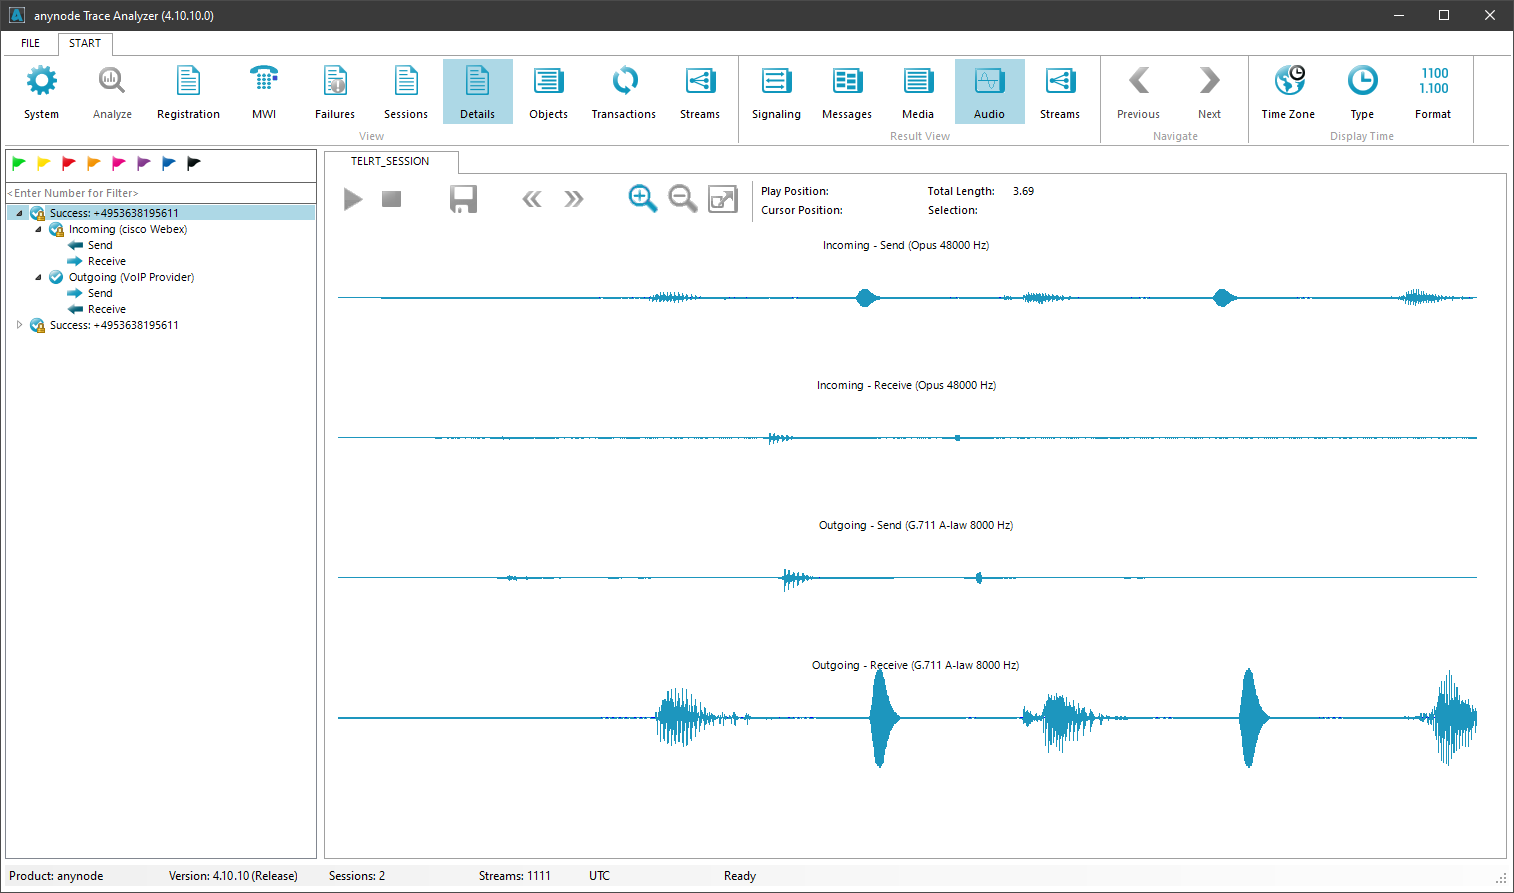
Click on Audio in the upper menu to view the recorded audio. Use Play to conduct an audio quality check.
Congratulations! You successfully configured Cisco Webex Calling with the anynode SBC! Your dedication and effort have paid off, and now you have a powerful solution in place for seamless communication. Well done on completing this TechNote, and may your Cisco Webex Calling experience be efficient, reliable, and beneficial for your organization.