SNMP Queries Using Paessler PRTG Network Monitor
This guide describes how to configure SNMP monitoring of anynode with the Paessler PRTG Network Monitor,
using a local SNMP request to localhost. With this setup, your PRTG instance will actively monitor your local
anynode system via SNMP, using the custom MIB-to-OIDLIB conversion. The setup supports fine-grained
monitoring using all supported OIDs, integrated seamlessly into PRTG’s powerful visualization and alerting engine.
Perform a Standard Express Installation of PRTG
Begin by downloading and installing the latest version of PRTG Network Monitor
using the Express installation mode. This will automatically configure a local probe and a default
"Probe Device 127.0.0.1" for localhost monitoring.
Copy the Converted anynode MIB (OIDLIB) File
Refer to the previous chapter, SNMP Queries Using Paessler SNMP Tester, to learn how to convert the anynode MIB file to an OIDLIB file.
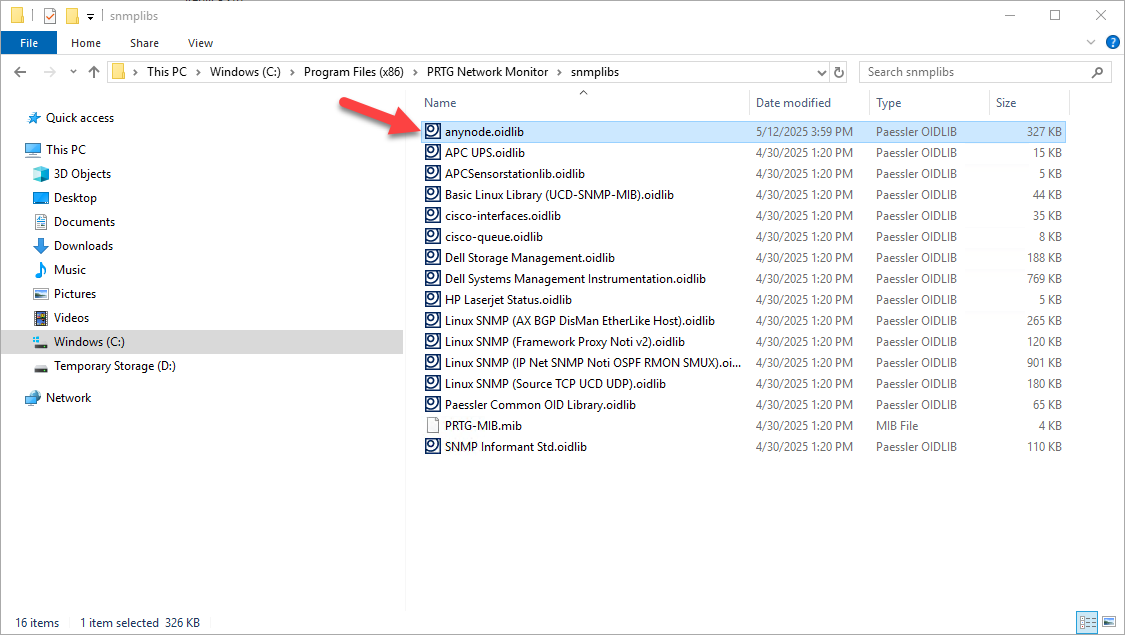
After installation, take your previously converted anynode MIB file—which is now an .oidlib file—and place
it in the following directory:
C:\Program Files (x86)\PRTG Network Monitor\snmplibs
PRTG loads SNMP libraries from the snmplibs folder. Placing the anynode.oidlib
file here ensures that PRTG can detect and use all Object Identifiers (OIDs) supported by anynode.
These OIDs define which SNMP data points (e.g., session count, system stats, etc.) can be queried by the sensor.
Open the PRTG Web Interface and Add a Sensor
In your browser, log into the PRTG web GUI. Use the browser shortcut or the GUI starter.exe at:
C:\Program Files (x86)\PRTG Network Monitor\PRTG GUI Starter.exe
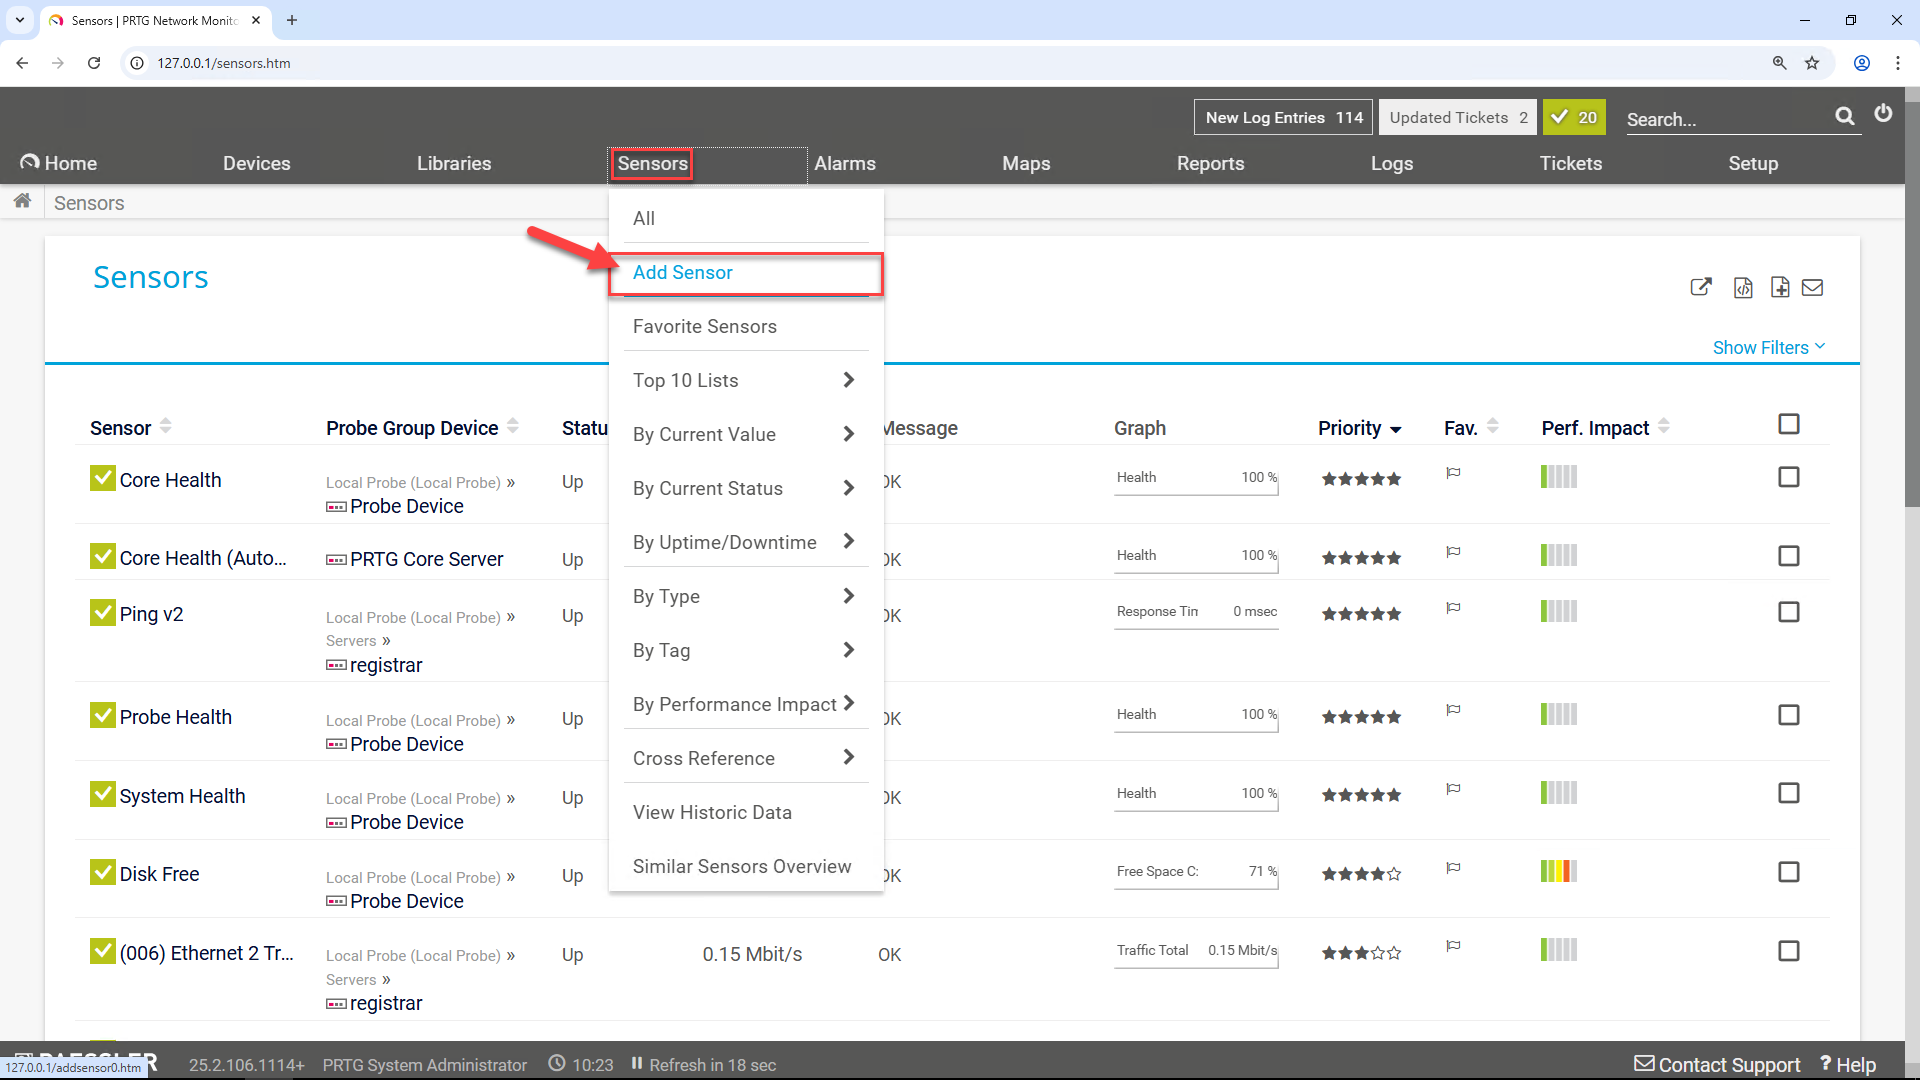
In the top menu, navigate to "Sensors" > "Add Sensor".
A Sensor in PRTG is a specific type of data query and measurement object, such as a ping, CPU load, memory usage, or—as in this case—an SNMP-based metric from a device like anynode.
Select the Device for the New Sensor
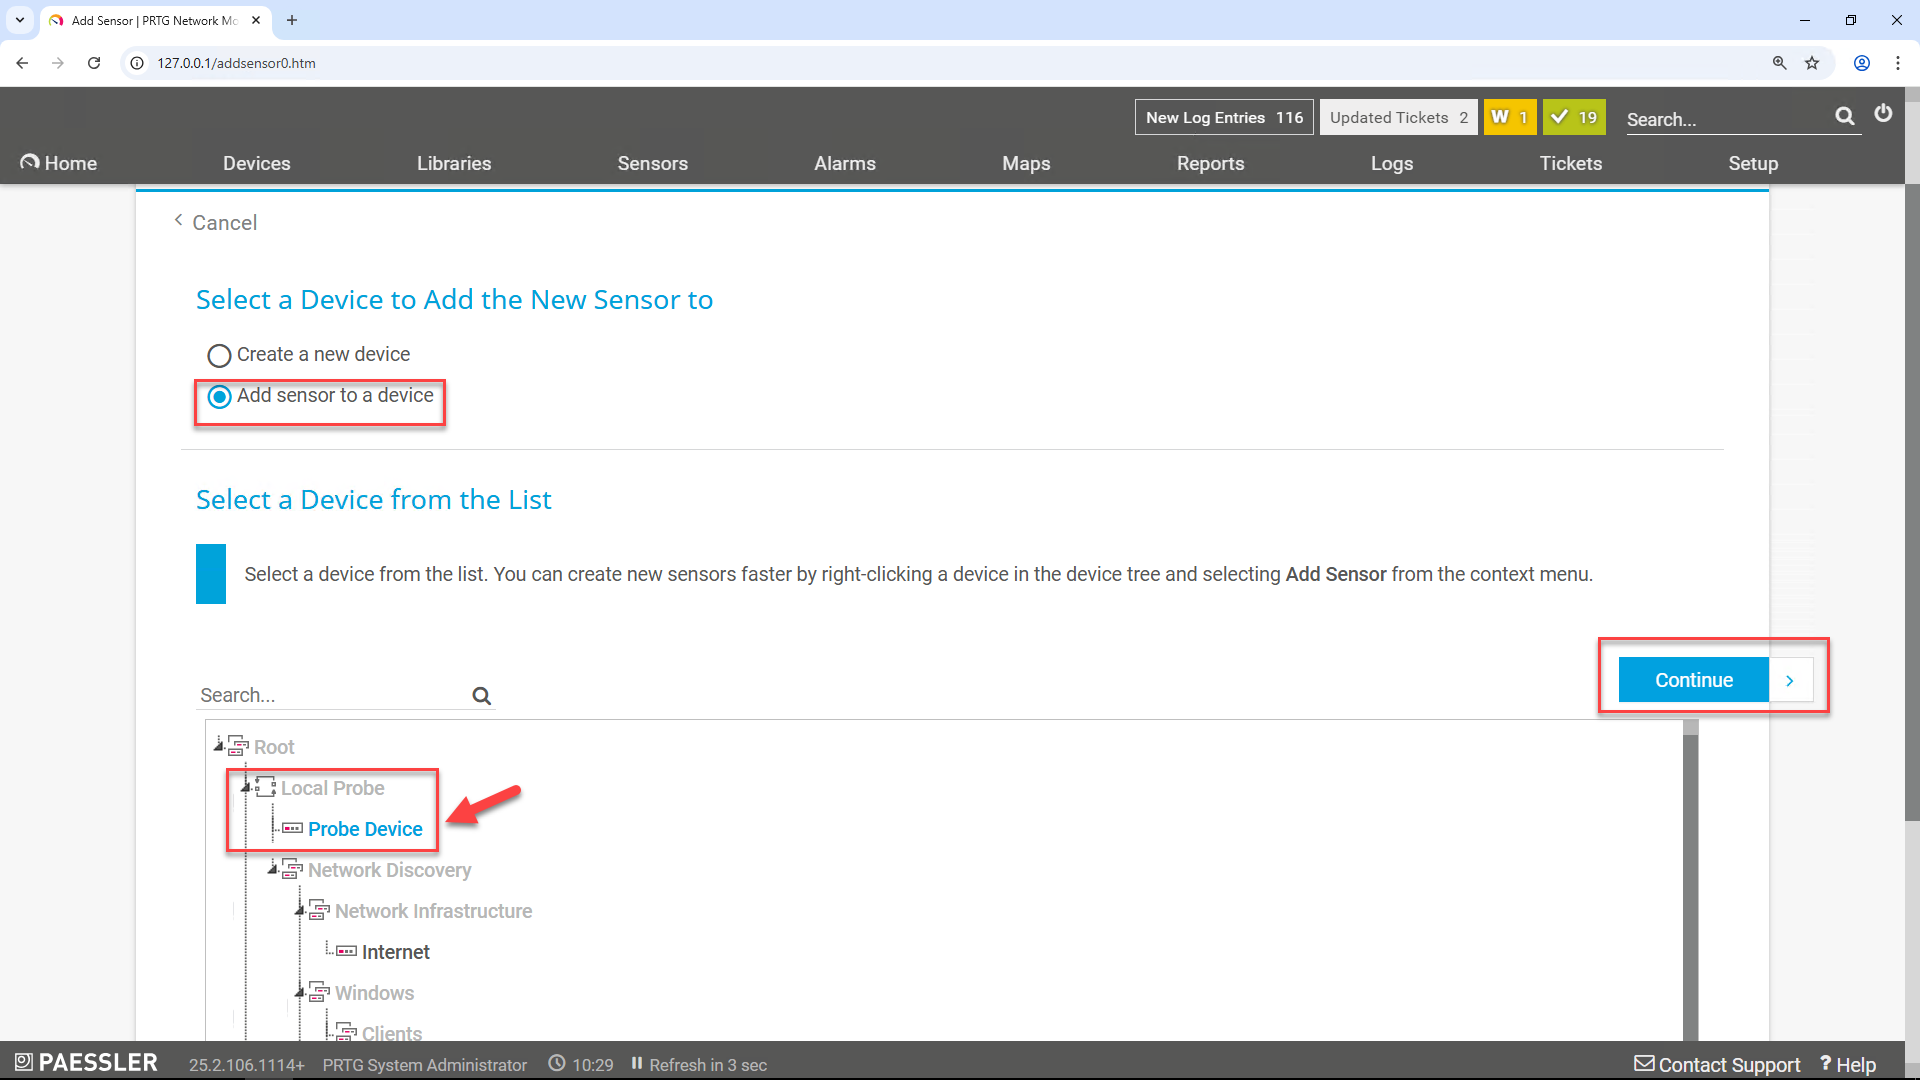
Under Select a Device to Add the New Sensor to, click Add sensor to a device
IIn Select a Device from the List, navigate through the root tree and choose:
Local Probe > Probe Device
Click the button on the right.
Wait a few seconds after clicking . The interface will load the available sensor types in a blue-shaded menu.
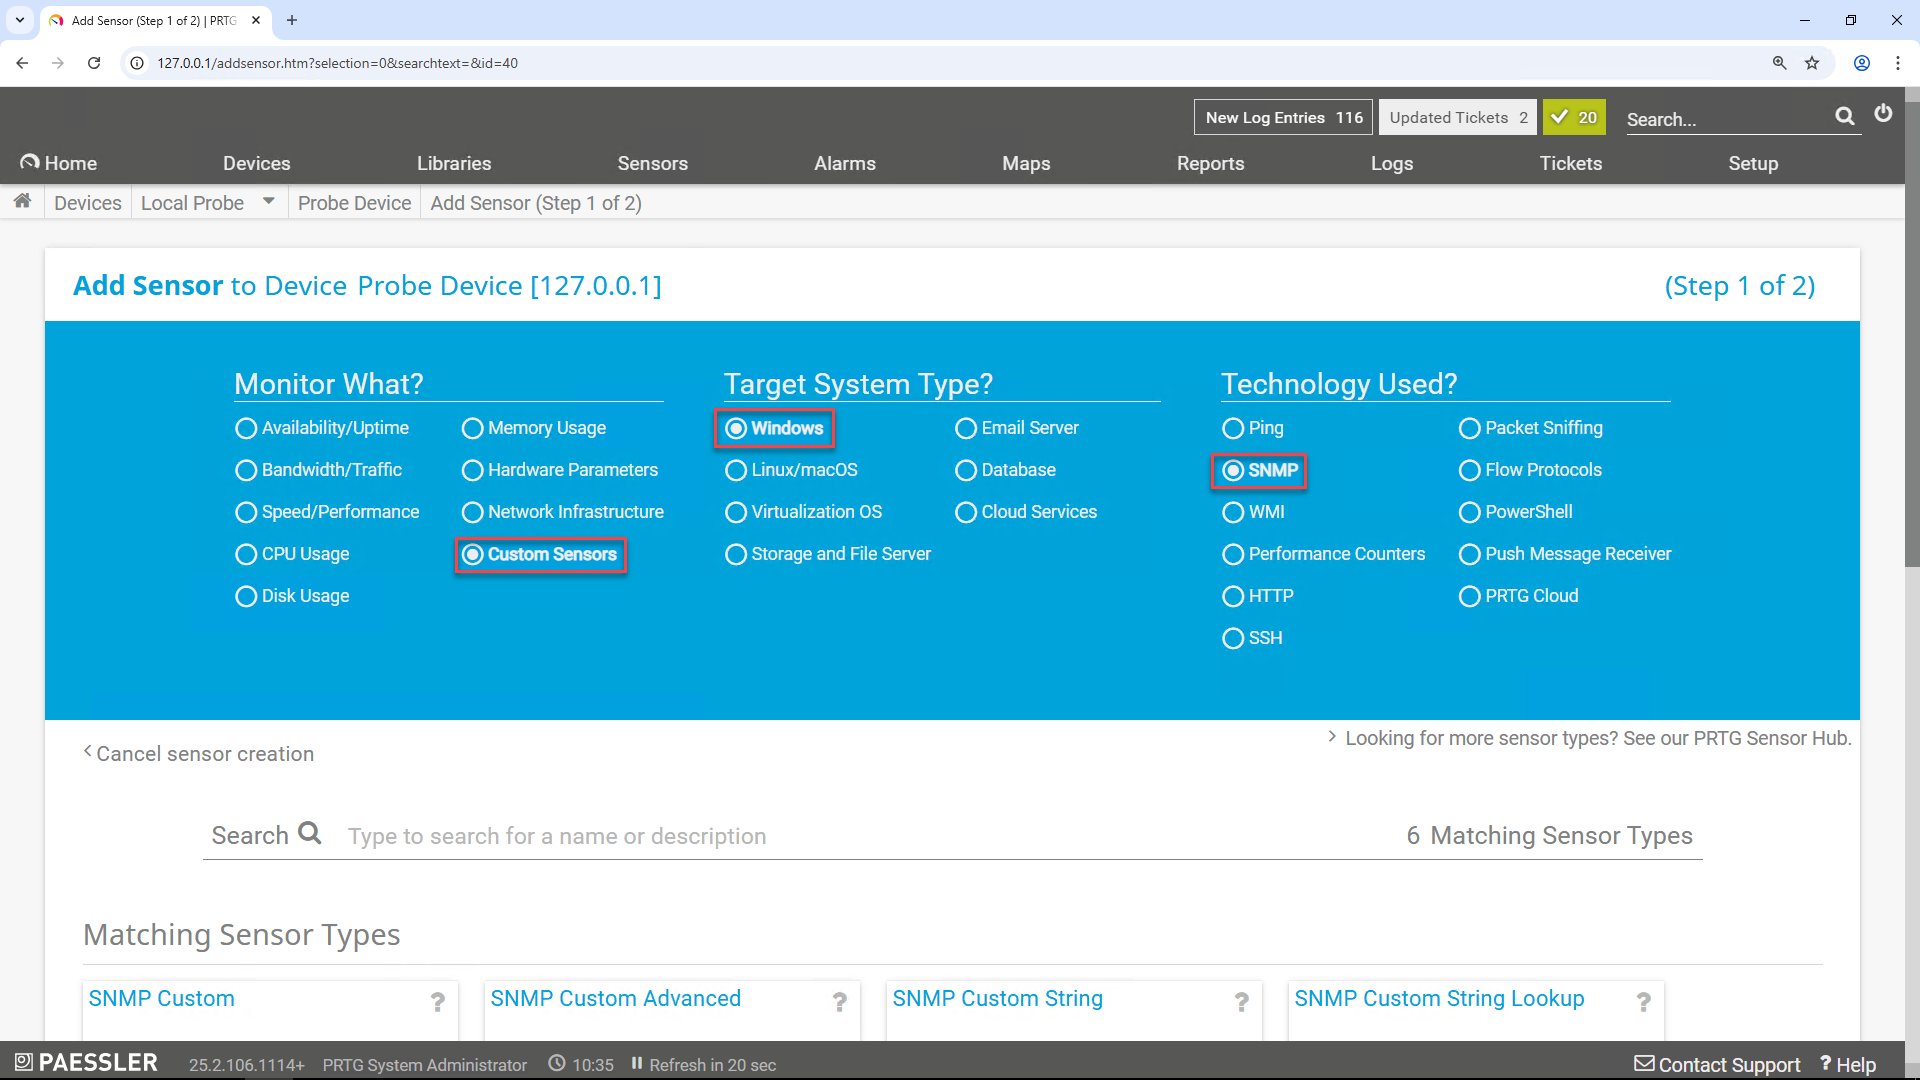
Configure the Sensor Type and Technology
In the blue panel:
Under "Monitor What?", select Custom Sensors
Under "Target System Type?", choose Windows
Under "Technology Used?", select SNMP
Add the SNMP Library Sensor
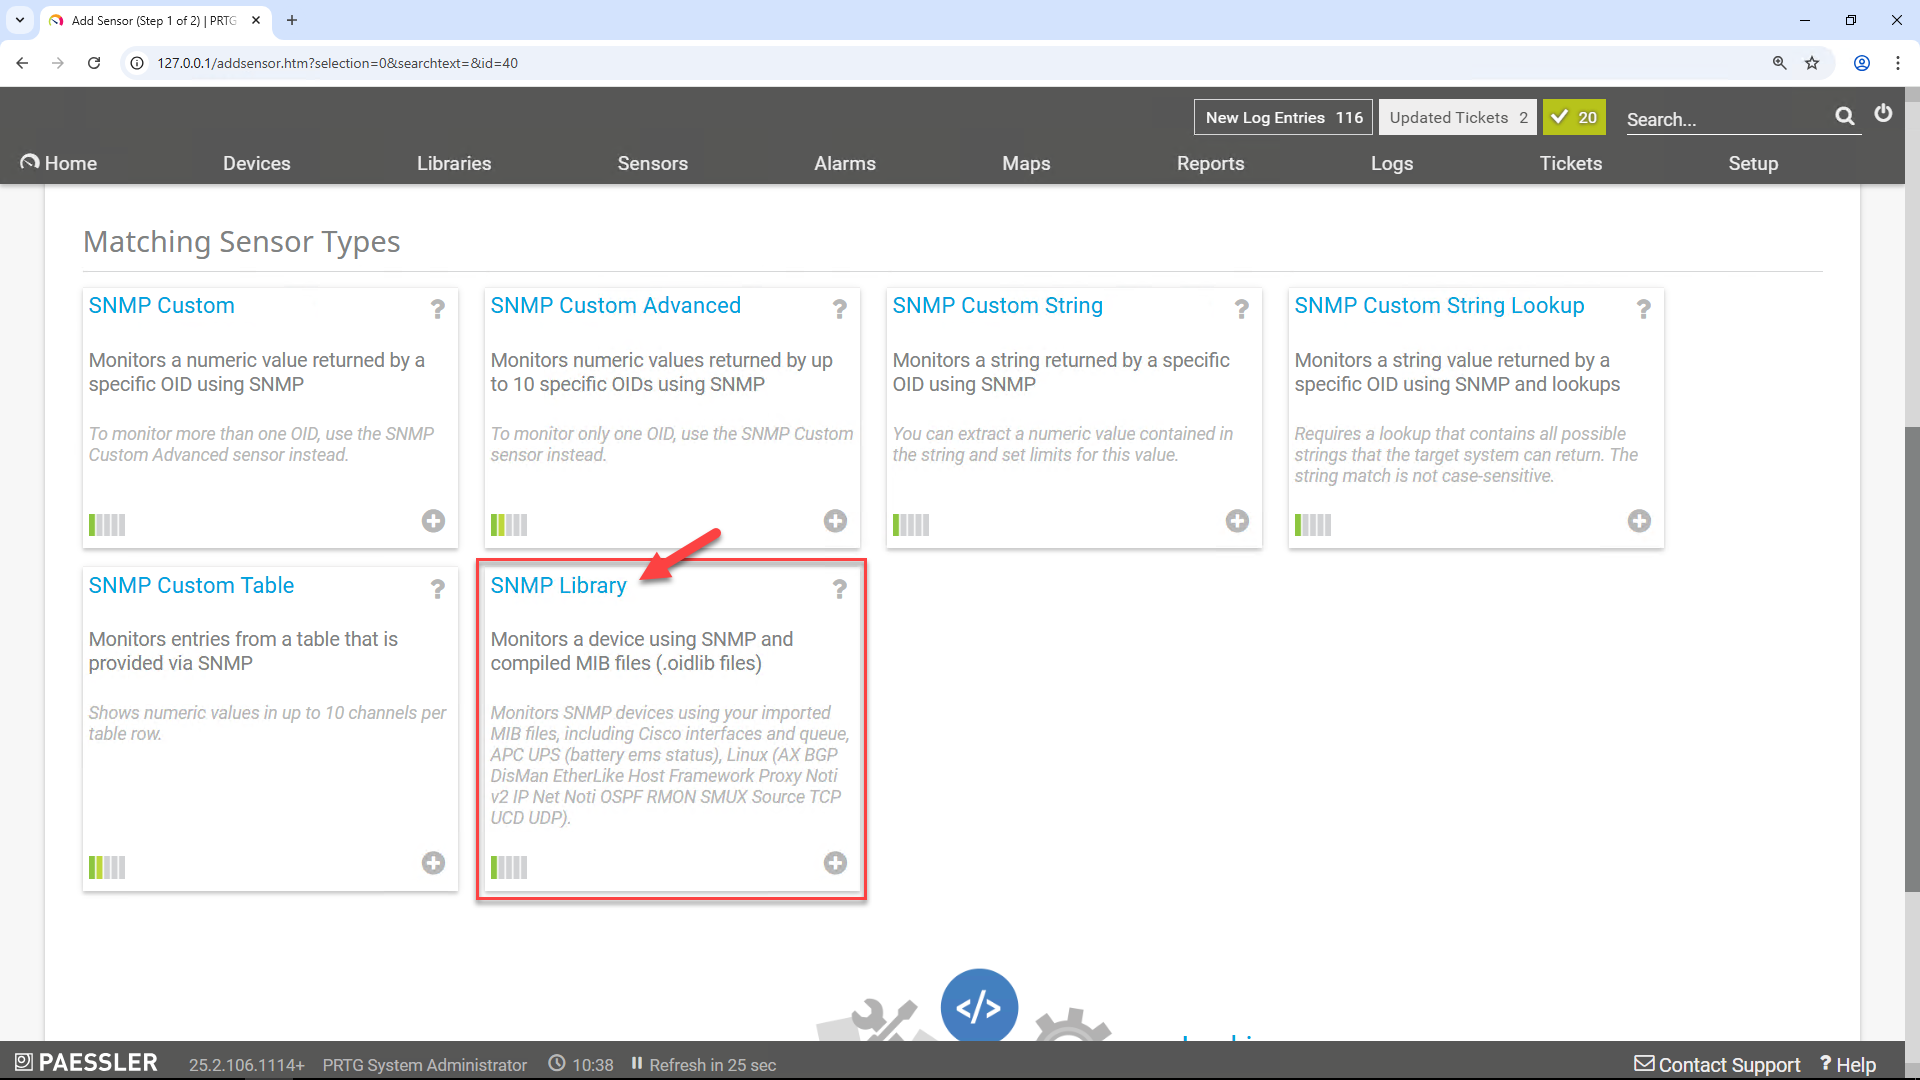
Scroll down to the Matching Sensor Types section:
Select "SNMP Library" as the sensor type
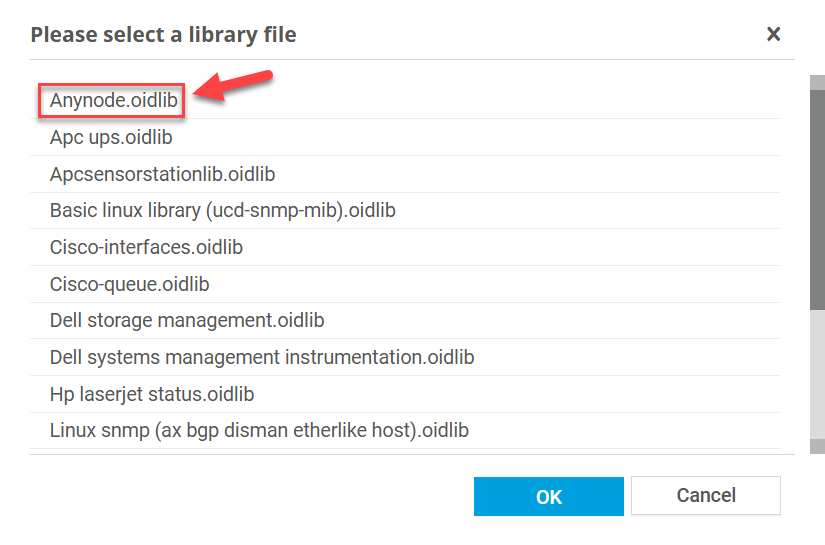
PRTG will now load all available .oidlib files from the snmplibs directory.
From the list, choose your anynode.oidlib file and click .
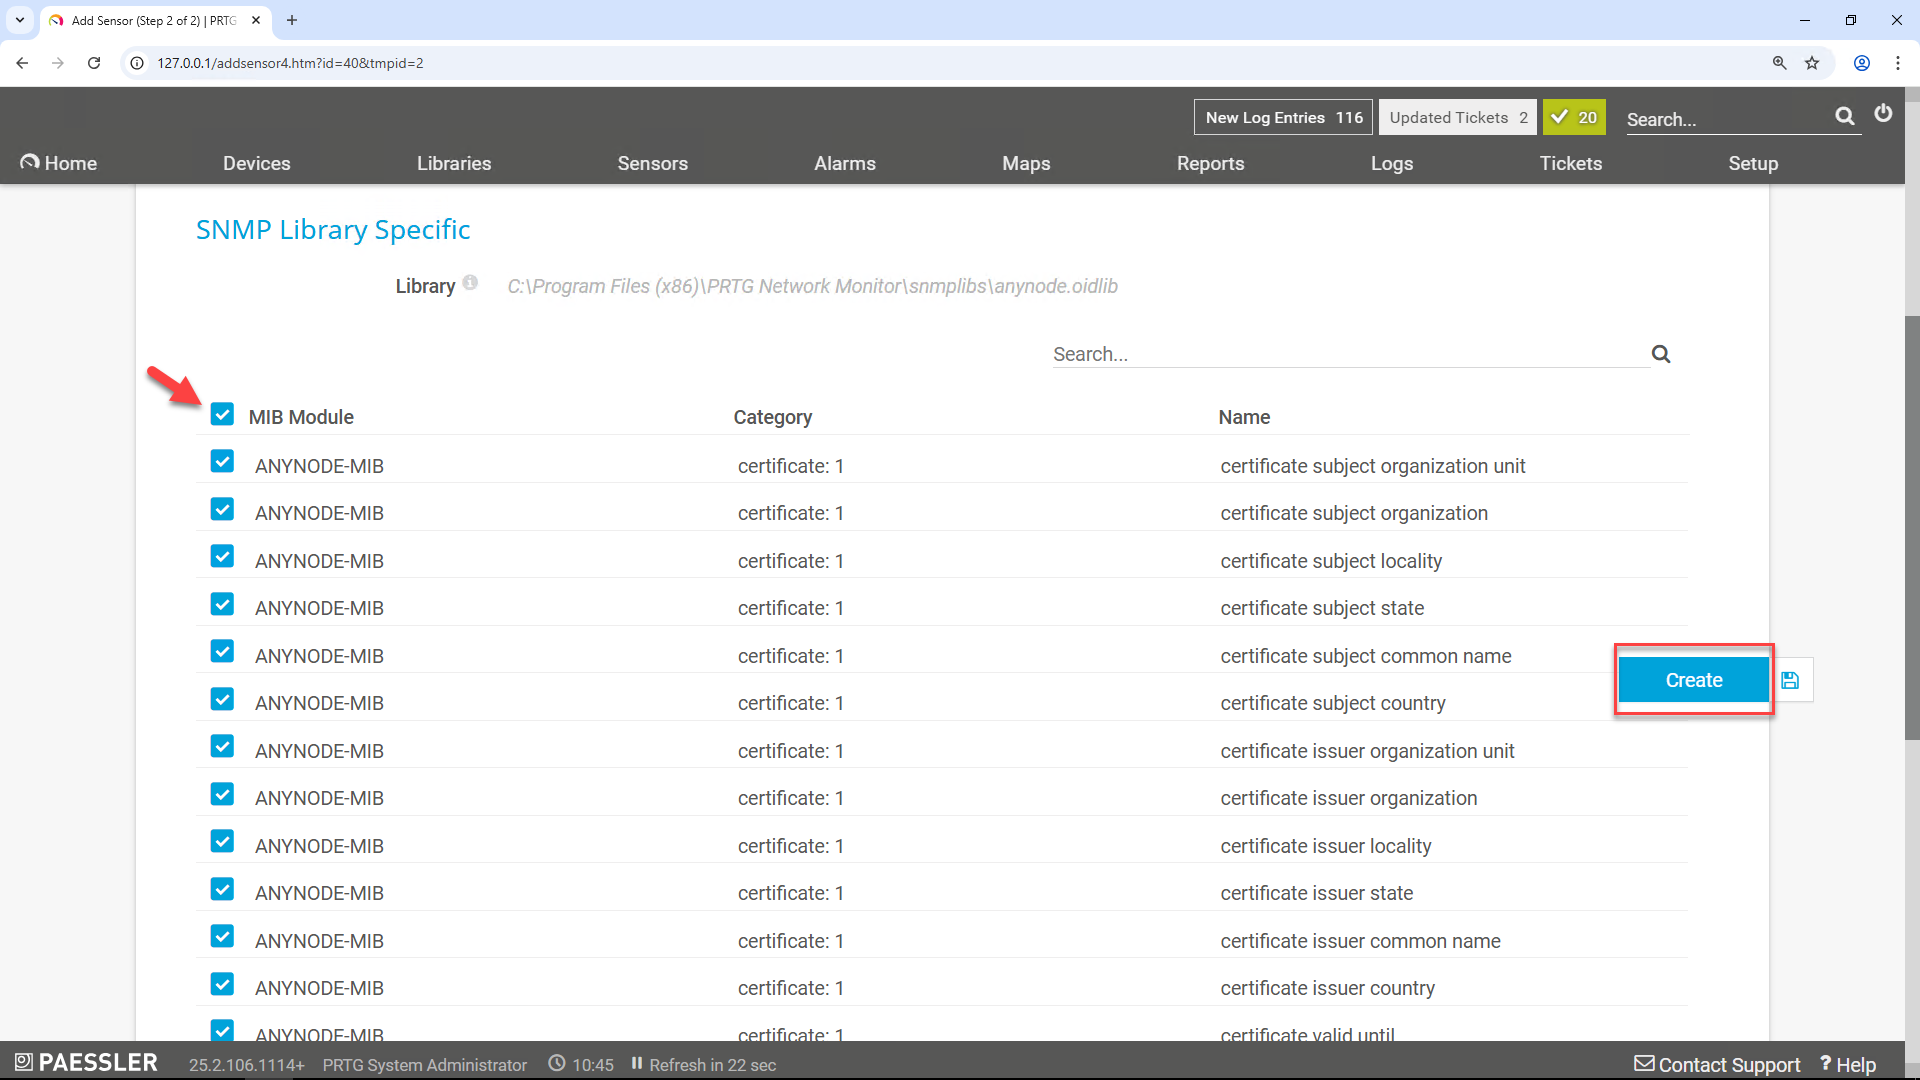
Select the upper-most MIB module (often the top-level checkbox) to automatically include all MIB elements from the anynode library.
You can keep the default scanning interval of 60 seconds.
Click on the right to add the sensor.
Sensor Initialization and Data Retrieval
Once created:
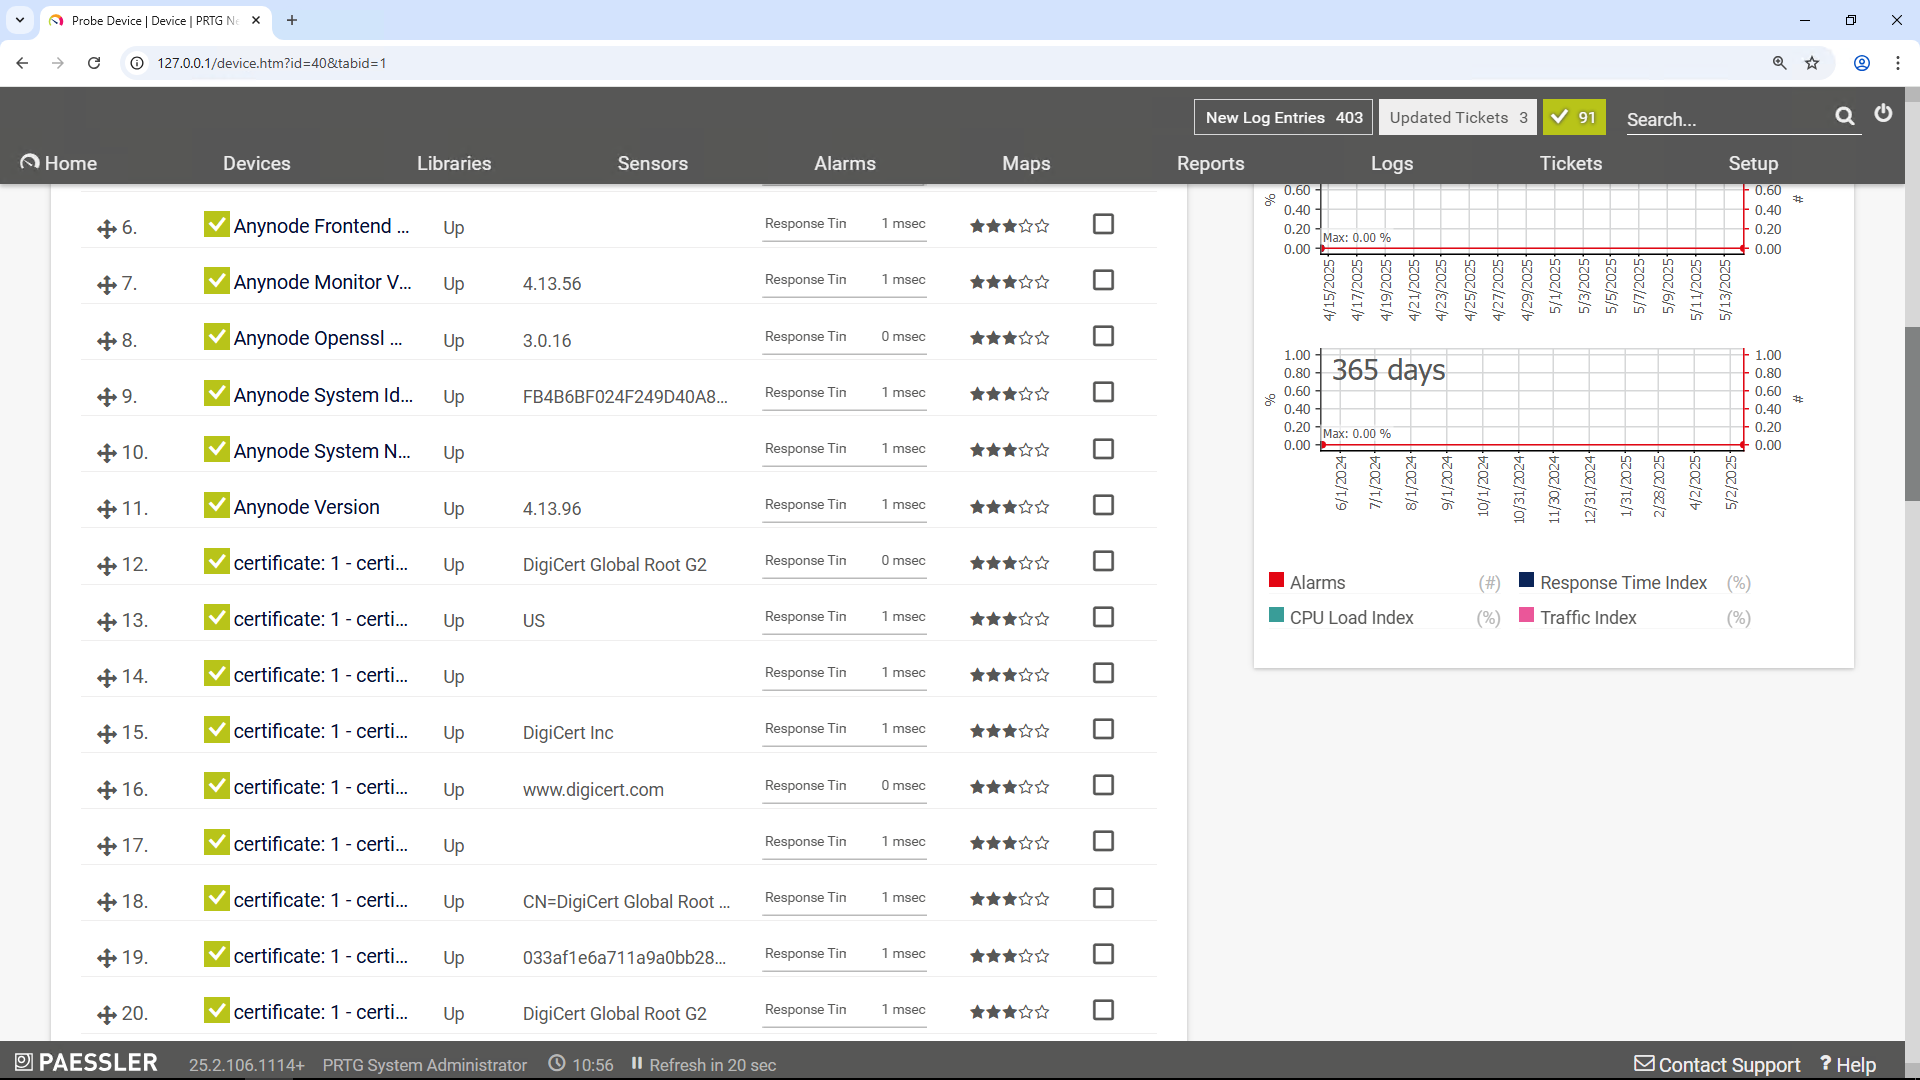
The sensor will be initialized and begin polling data.
The first results typically appear within 60 seconds.
Additional metrics will follow in the next one or two update intervals.
How to Display Date and Time Formats from anynode in PRTG
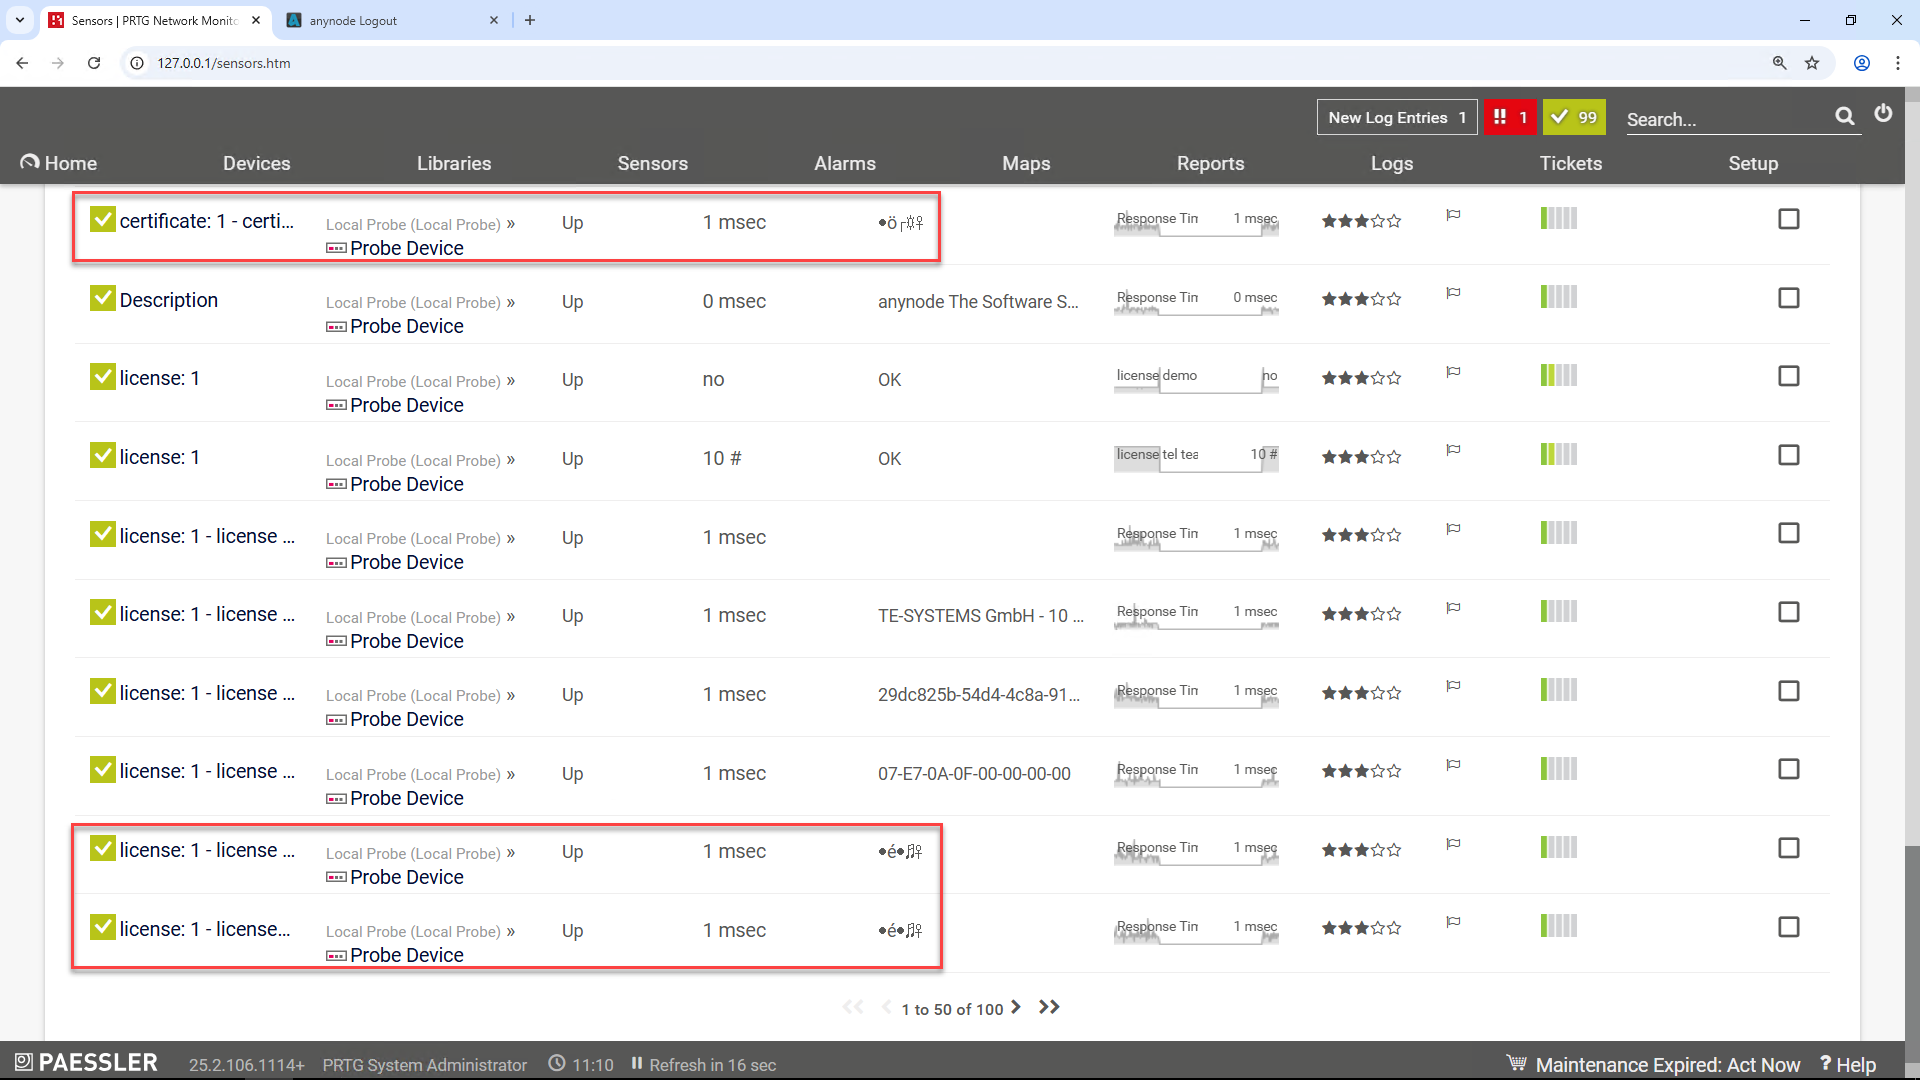
Currently, PRTG Network Monitor does not natively support this data type. The reason is that anynode DATE / TIME values in SNMP are encoded as OCTET STRING (typically following the DateAndTime format defined in RFC 2579), which cannot be directly translated into a numerical format that PRTG can process effectively. However, it is possible to read anynode DATE / TIME values via a custom script.
The PRTG Network Monitor will display the anynode date / time formats in an unreadable format
This guide explains how to integrate a custom PowerShell script into Paessler PRTG Network Monitor
to retrieve and display the license expiration date from the anynode Session Border Controller
via SNMP. The script reads the LicenseValidUntilOID, interprets the standard DateAndTime
format (RFC 2579), and provides a human-readable output for use in a PRTG EXE/Script Sensor.
This is particularly useful when you want to:
-
Display the license expiry date of anynode directly in PRTG.
-
Get alerted when the license is missing (returns NULL) or about to expire.
-
Monitor multiple anynode instances centrally via SNMP.
The script uses:
-
snmpget.exefrom Net-SNMP -
PowerShell to parse the returned Hex-STRING from the OID
.1.3.6.1.4.1.42303.2.4.2.1.7.1 -
PRTG-compatible output format (
<status>:<message>) for use with EXE/Script sensors
If you're using the script inside Paessler PRTG Network Monitor, you do not need to hardcode the hostname or IP address of your anynode instance in the script itself.
In the script section between lines 13–17, the hostname is dynamically assigned based on the script parameter.
If no parameter is passed, it defaults to 127.0.0.1.
In the Parameters field of the specific sensor settings in PRTG Network Monitor, enter the IP address or hostname of your anynode instance if you are not using the default value 127.0.0.1.
Open the script with Windows PowerShell ISE and save the script as
anynodeLicenseValidUntil.ps1
Place it in the following directory on the PRTG core server:
C:\Program Files (x86)\PRTG Network Monitor\Custom Sensors\EXE\
Open PRTG Web GUI
In your browser, log into the PRTG web GUI. Use the browser shortcut or the GUI starter.exe at:
C:\Program Files (x86)\PRTG Network Monitor\PRTG GUI Starter.exe
In the top menu, navigate to "Sensors" > "Add Sensor".
Select the Device for the New Sensor
Under Select a Device to Add the New Sensor to, click Add sensor to a device
A Sensor in PRTG is a specific type of data query and measurement object, such as a ping, CPU load, memory usage, or—as in this case—an SNMP-based metric from a device like anynode.
In Select a Device from the List, navigate through the root tree and choose:
Local Probe > Probe Device
Click the button on the right.
Wait a few seconds after clicking . The interface will load the available sensor types in a blue-shaded menu.
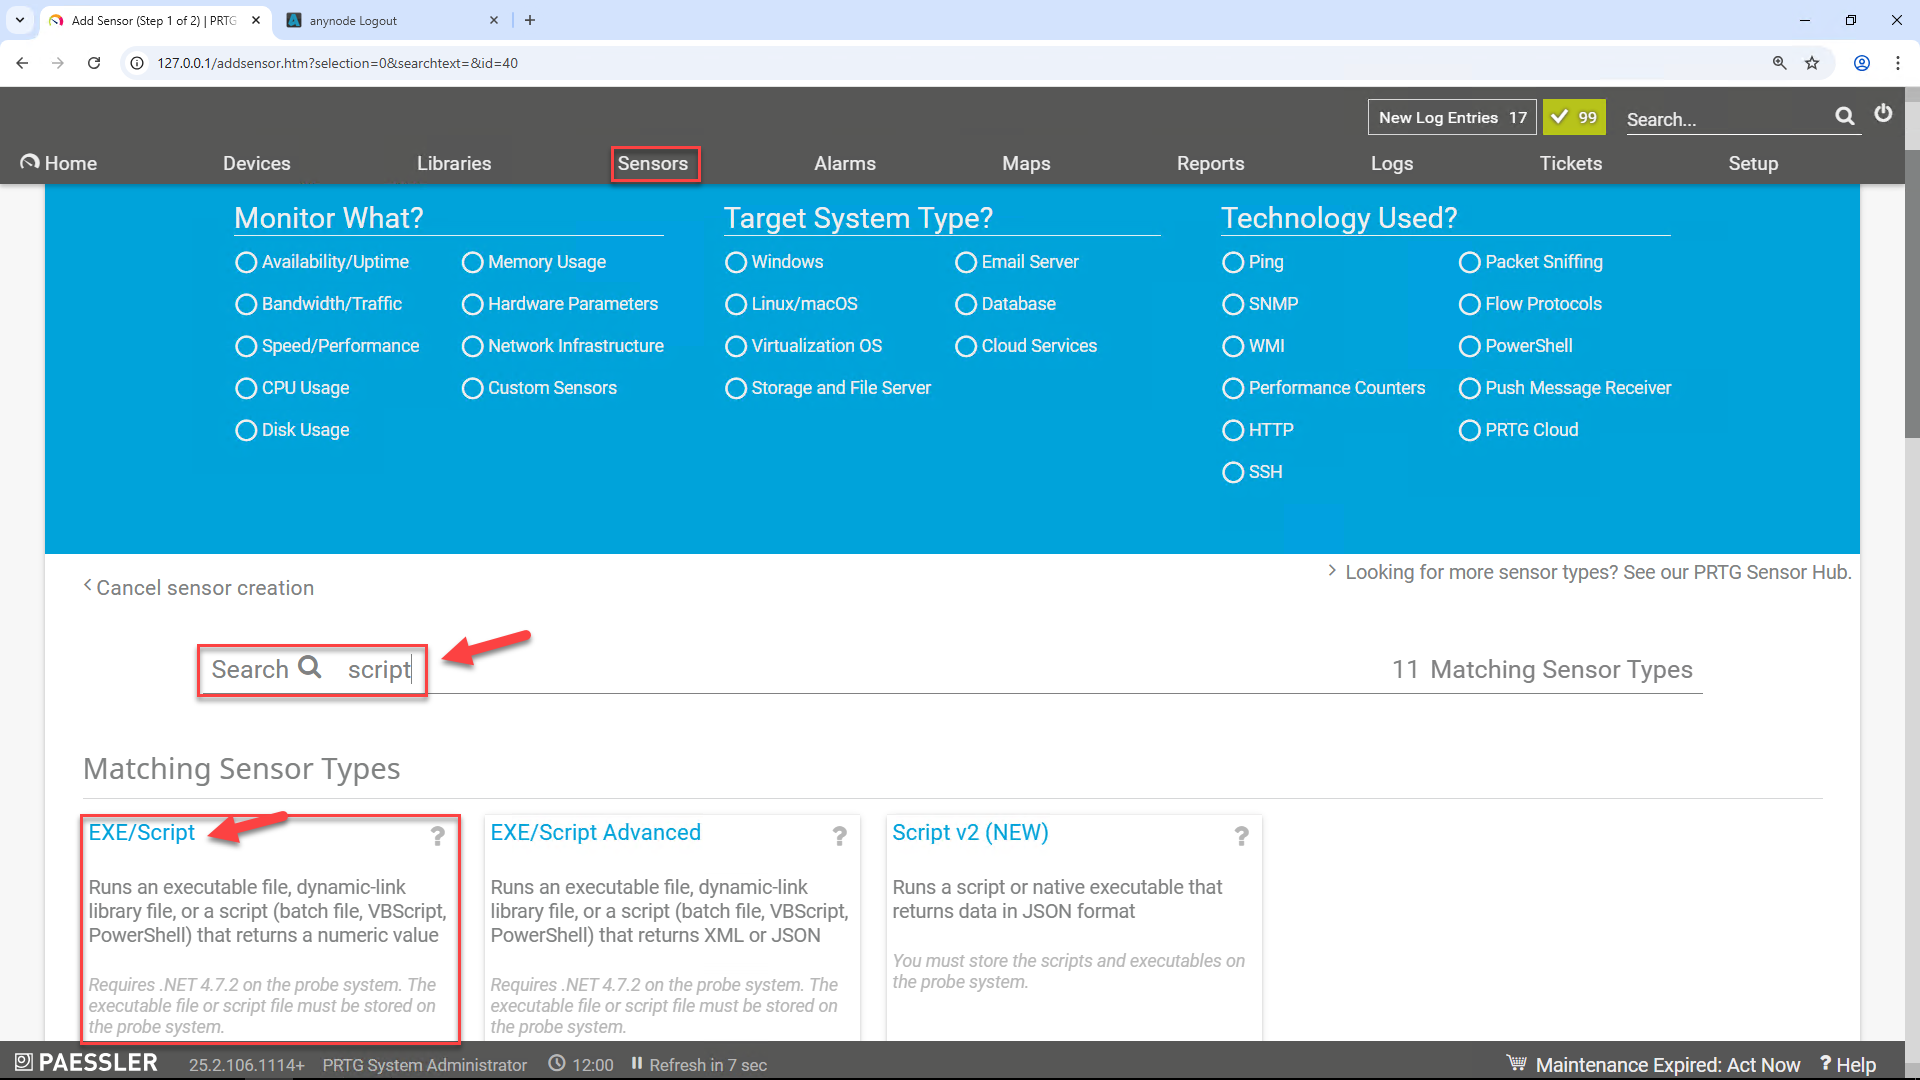
Do not select anything from the blue “Monitor What? › Target System Type › Technology Used” menu.
Use the search field and search for script.
At Matching Sensor Types, choose EXE/SCRIPT.
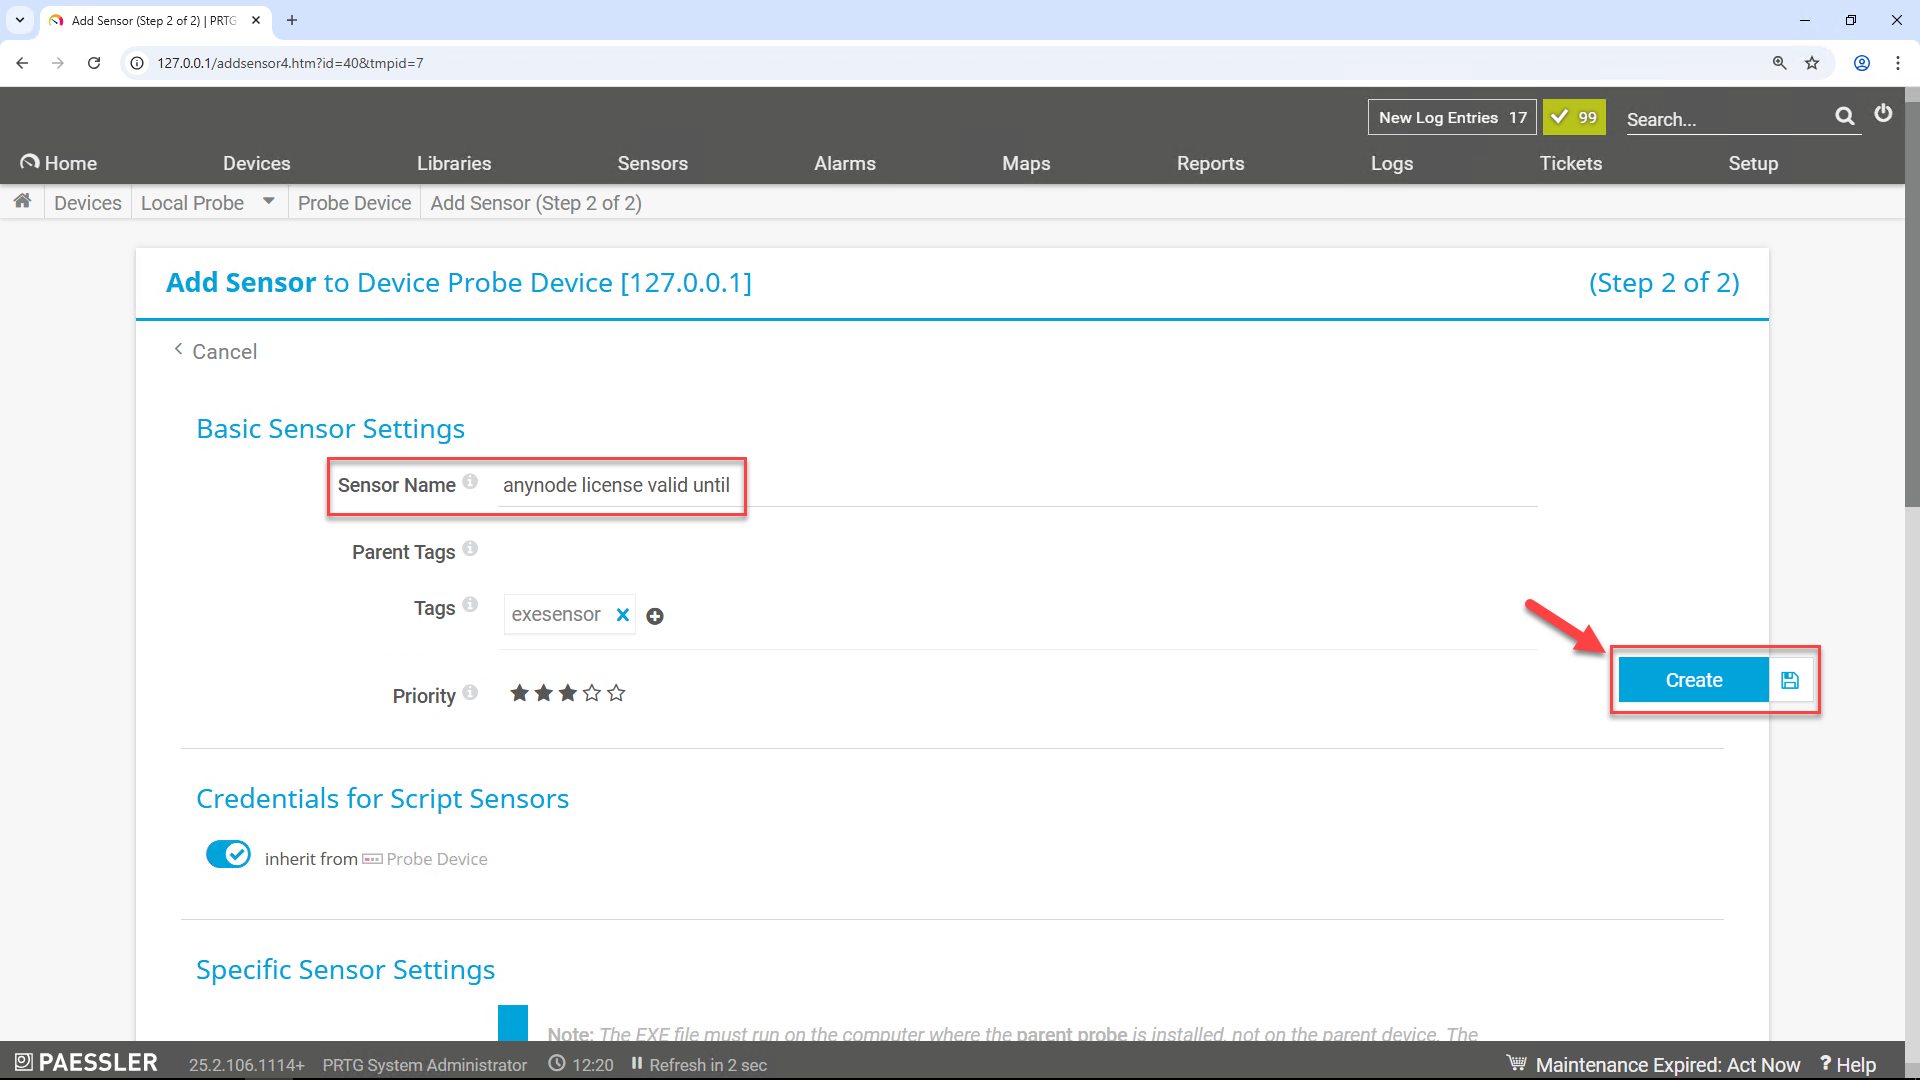
Enter a name to identify the sensor. By default, PRTG shows this name in the device tree, in alarms, logs, notifications, reports, maps, libraries, and tickets. In our example, we use "anynode license valid until".
At Specific Sensor Settings, choose the anynodeLicenseValidUntil.ps1 script from
the script list.
In the Parameters field of the Specific Sensor Settings in PRTG Network Monitor,
enter the IP address or hostname of your anynode instance if you are not using the default value 127.0.0.1.
Click on the button.
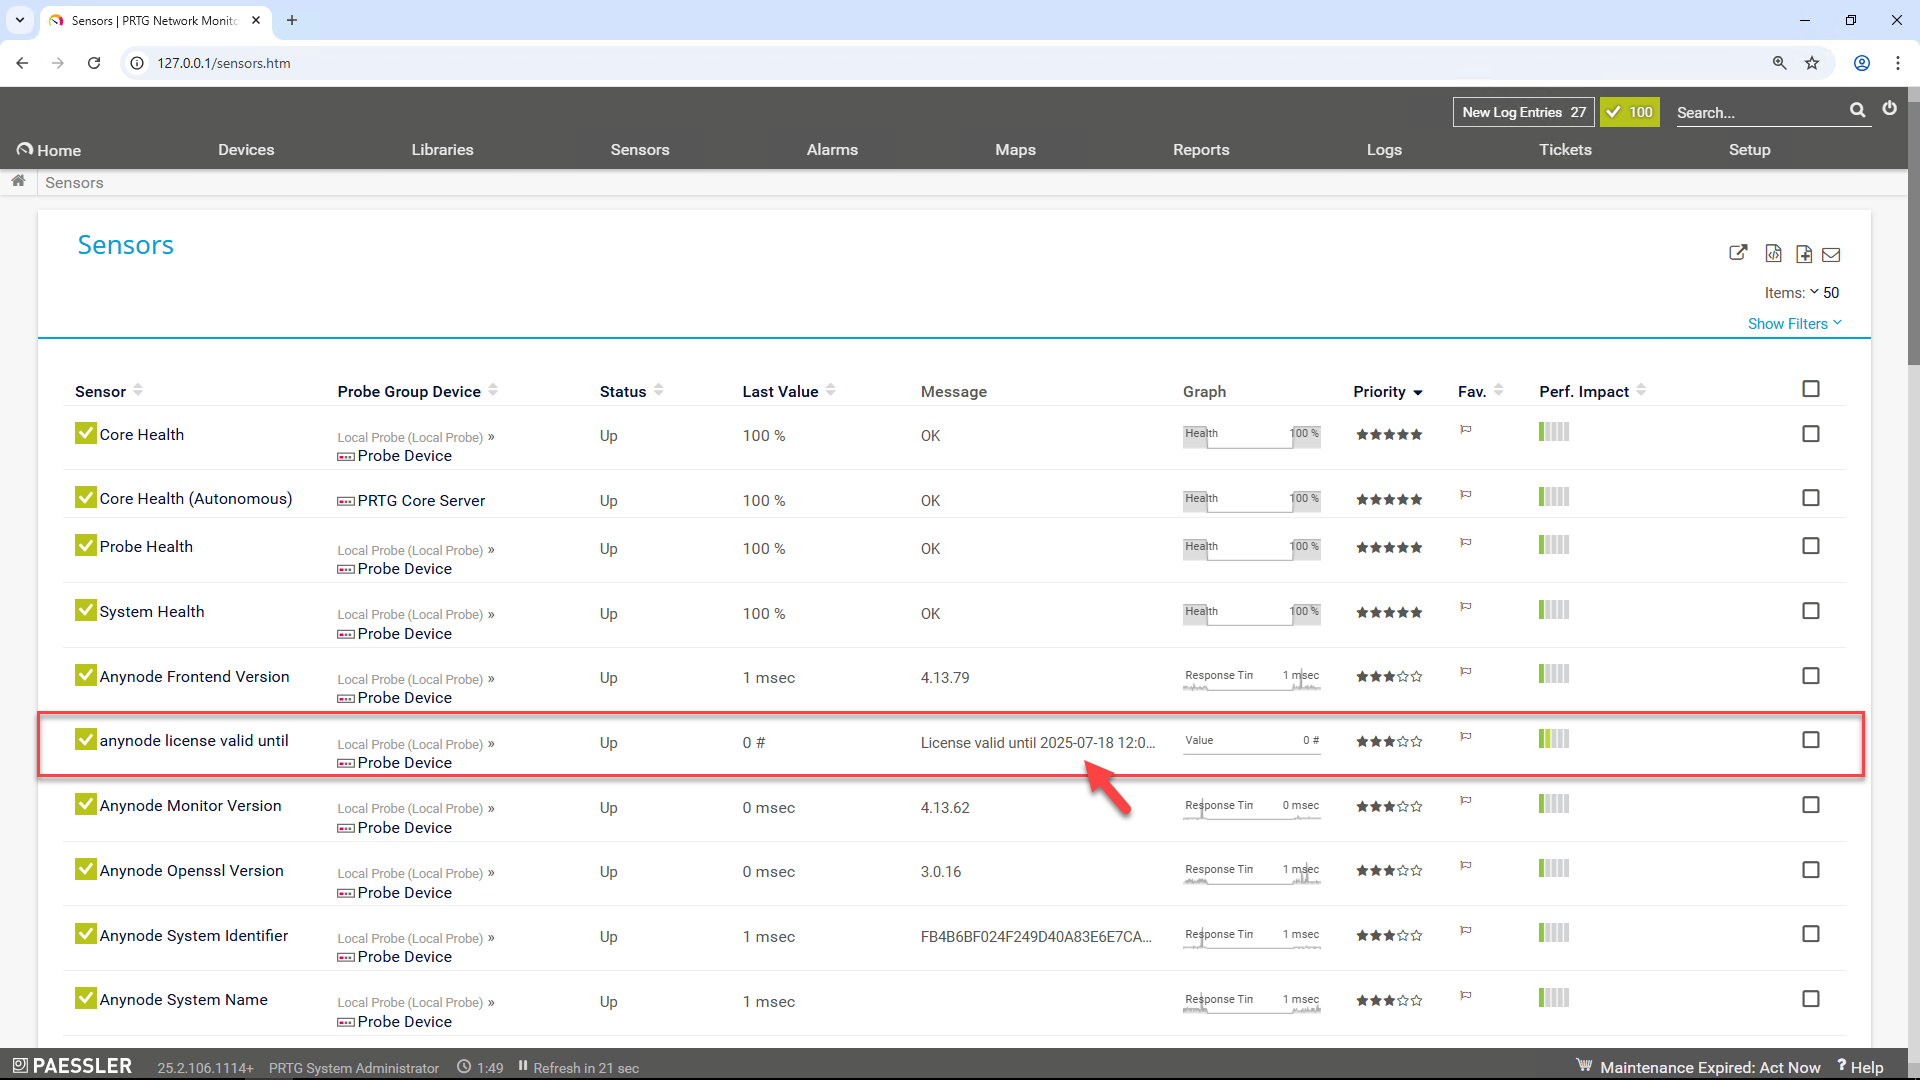
You can now display the license expiry date of anynode directly in PRTG. The script returns a one-line output that PRTG interprets.
List of anynode OIDs with Date / Time Format
The Licenses Group
The <index> at the end of the OID selects the instance. Tools such as snmpget, snmpwalk,
PRTG, LibreNMS, and others expect a dot (.) before the index in the OID.
Name: licenseExpiresInDays
OID: .1.3.6.1.4.1.42303.2.4.2.1.5.<index>
Request Type: GET
Description: If the license is time-limited (licenseValidUntil contains a valid date), this indicates the amount of days until the license will expire or zero if the license is expired. If the license is not time-limited, the value is always zero.
Name: licenseValidFrom
OID: .1.3.6.1.4.1.42303.2.4.2.1.6.<index>
Request Type: GET
Description: The UTC date and time when the license becomes active. The format is an eight-byte octet string in the short DateAndTime format.
Name: licenseValidUntil
OID: .1.3.6.1.4.1.42303.2.4.2.1.7.<index>
Request Type: GET
Description: The UTC date and time when the license will expire. The format is an eight-byte octet string in the short DateAndTime format. If the license is not limited, all octets are set to zero.
Name: licenseSUSUntil
OID: .1.3.6.1.4.1.42303.2.4.2.1.9.<index>
Request Type: GET
Description: The UTC date as a readable string when the software upgrade service will end. The format is an eight-byte octet string in the short DateAndTime format.
Name: licenseAutoUpdaterFailed
OID: .1.3.6.1.4.1.42303.2.4.2.1.19.<index>
Request Type: GET
Description: The UTC date as a readable string when the auto updater failed the last time to validate the license. If no failure occurred, the value is zero. The format is an eight-byte octet string in the short DateAndTime format.
