
Validate SIP Traffic on Grafana UI
Open your browser and try:
That’s the Grafana UI exposed directly by the all-in-one stack. DeepWiki
Default login (if you haven’t changed it yet):
-
user:
admin -
password:
admin(you’ll be prompted to change it)
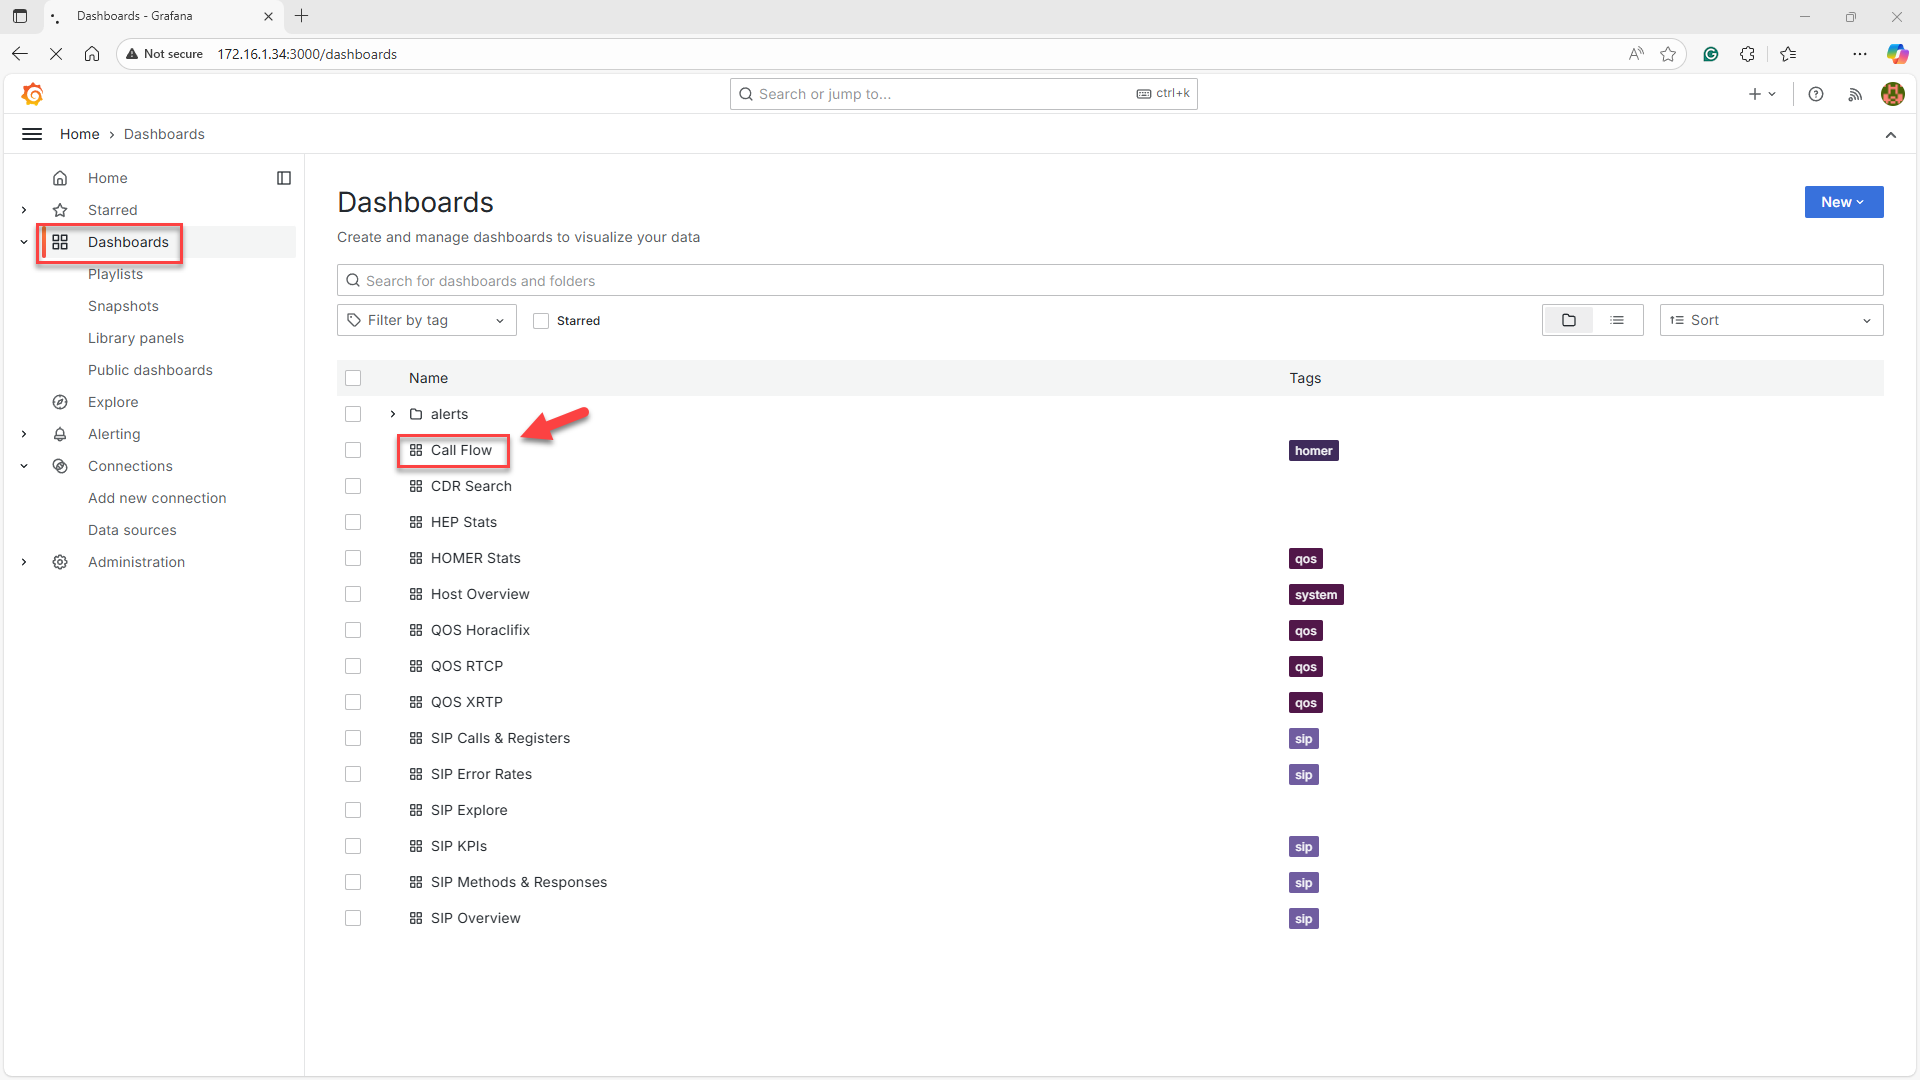
Inside Grafana you’ll find ready-made Homer / HEP / SIP dashboards that visualize what heplify-server + qryn + ClickHouse are storing.
Click on Dashboards in the left menu. Navigate to Call Flow in the Dashboards list and click on it.
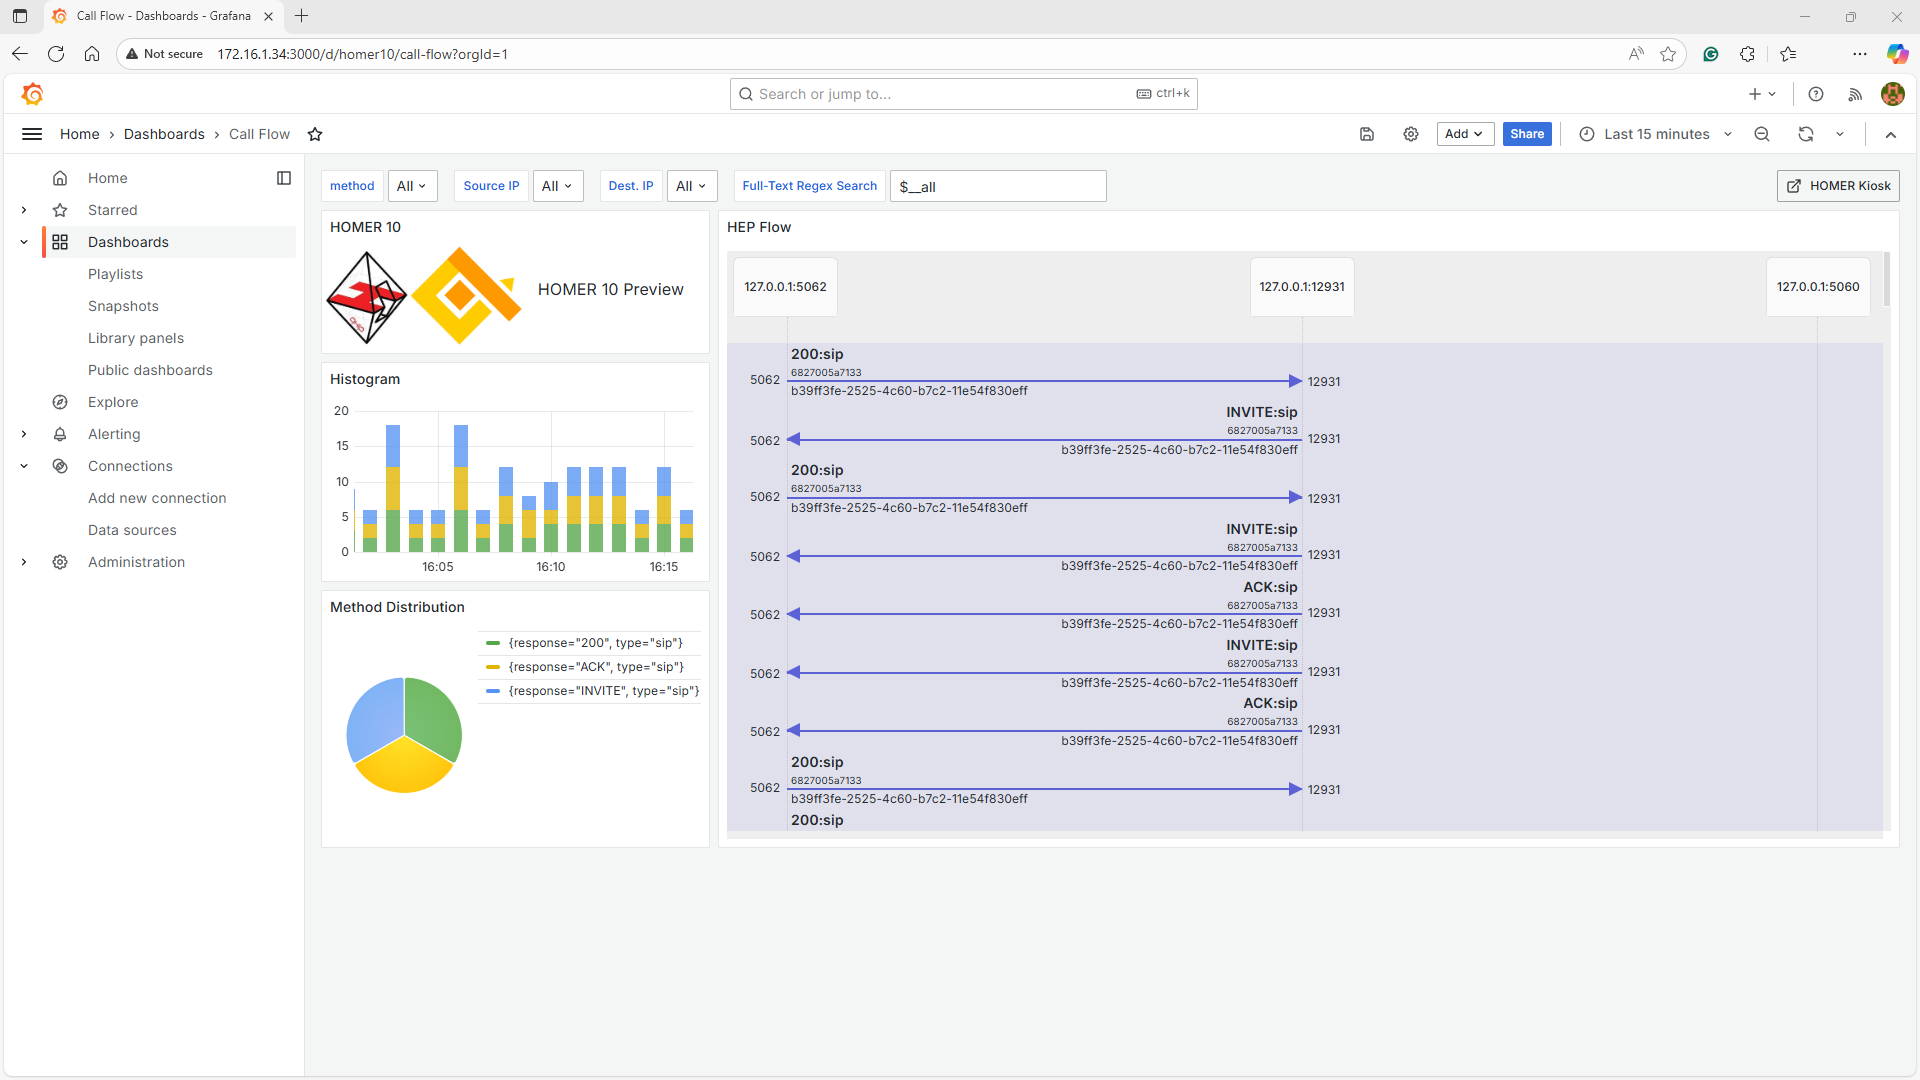
Place a call through anynode.
Refresh Homer UI.
You should see
-
INVITE
-
REGISTER
-
BYE
-
And full call flows
Congratulations, your full Homer 10 + Grafana + anynode Setup on Windows is now working.
This architecture is now deployed:
Windows Host: 172.16.1.34
Docker Desktop
-
heplify-server (HEP)
-
homer-app (API)
-
homer-ui (Web GUI)
-
grafana (dashboards)